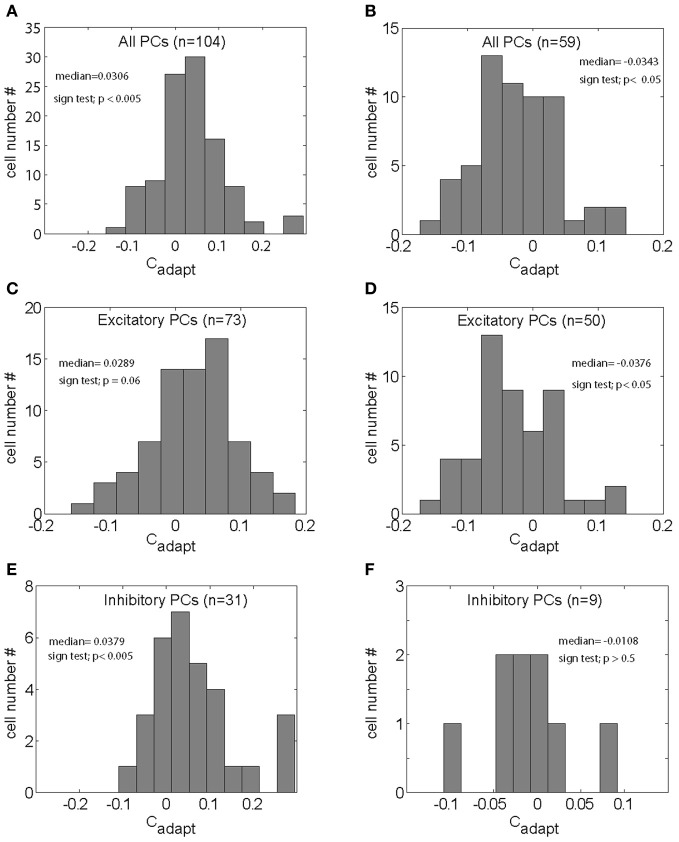
Figure 4.
(A,B) Distributions of the index capturing the adaptation related modulation (Cadapt) for all the PC SS tested for gain-increase SPA (A) and gain-decrease SPA respectively (B). (C,D) Distributions Cadapt for all excitatory PC SS tested for gain-increase SPA (C) and gain-decrease SPA (D), respectively. (E,F) Distribution of Cadapt for the inhibitory PC SS subjected to gain-increase (E) and gain-decrease SPA respectively (F).

