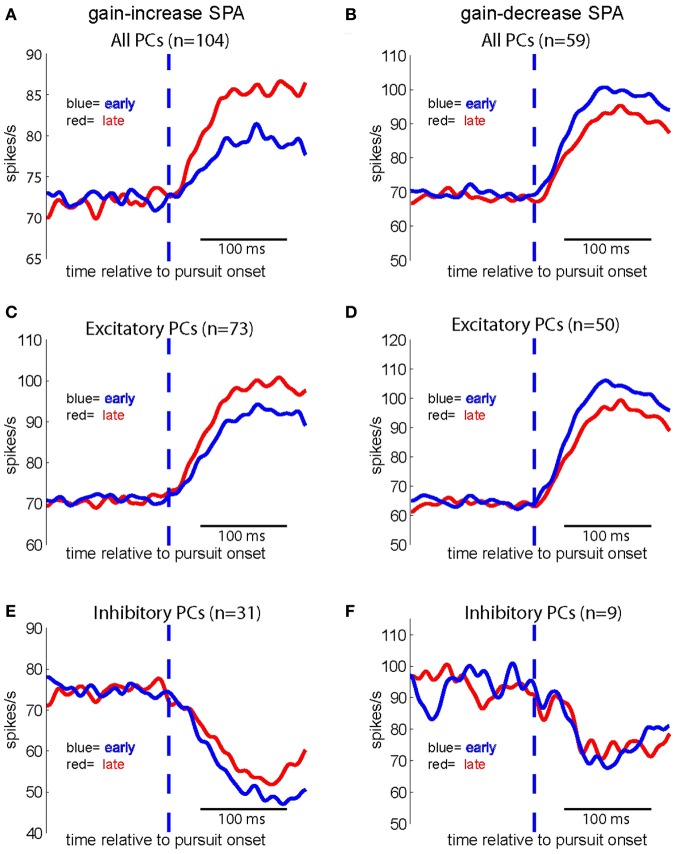
Figure 6.
Population spike density functions for different groups of PC SS subjected to either gain increase (left panels) or to gain decrease SPA (right panels) for the first (red) and the last quarter of trials (blue). Upper row: population spike density functions based on all PC SS tested for gain-increase SPA (n = 104) (A) and gain-decrease SPA (n = 59) (B) middle row: population spike density functions for all excitatory PC SS tested for gain-increase (n = 73) (C) and gain-decrease SPA (n = 50) (D) bottom row: population spike density functions for all inhibitory PC SS tested for gain-increase SPA (n = 31) (E) and gain-decrease SPA (n = 9) (F).

