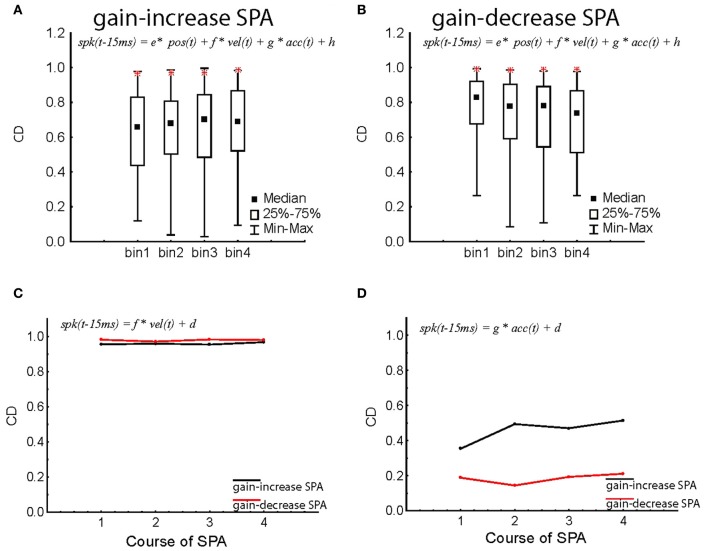
Figure 7.
Changes in the coefficient of determination (CD = r2; see “Materials and Methods,” Equation 2) of individual PC SS and population response during gain-increase SPA (A) and gain-decrease SPA (B). The distribution of CD for individual PC SS is shown in median/quartile values of CDs throughout the course of SPA divided up into four bins for the entire population of PC SS. The CDs obtained for the instantaneous population response are added as red stars in the corresponding bin characterizing the adaptation course. Note that the CDs for the population response are much larger than the vast majority of individual PC SS. (C,D) Degraded regression models restricted to eye velocity (C) and eye acceleration (D) respectively as function of the four bins characterizing the course of SPA. The population response was based on all PC SS, independent of response type. The CDs of gain-increase SPA are shown in black, the ones for gain-decrease SPA in red. All the CDs computed in this figure are for Δ = 15 ms.

