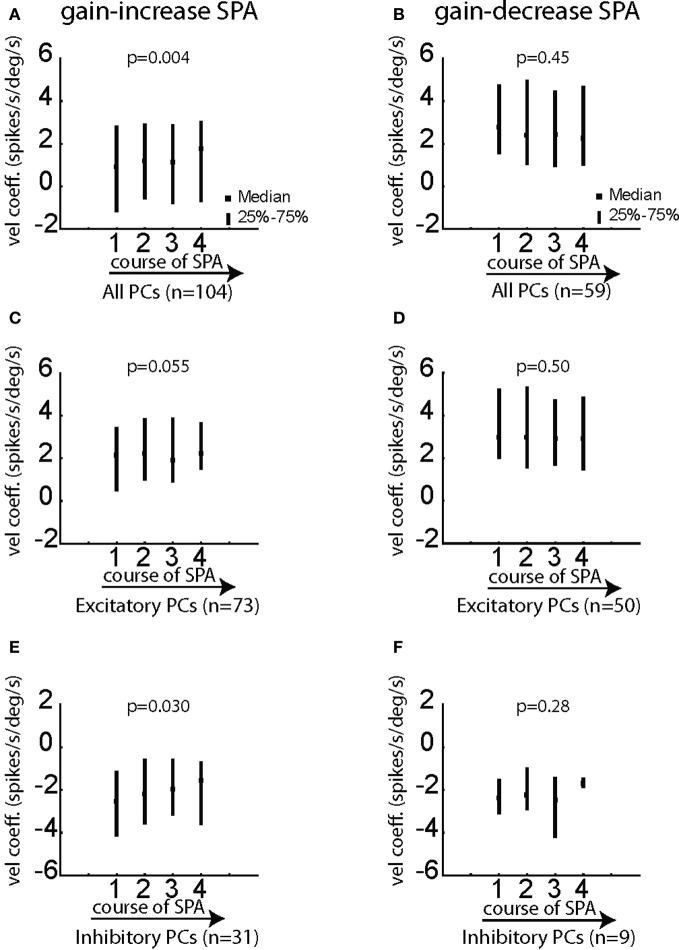
Figure 9.
Changes of the velocity coefficient b in the equation [spk(t − Δ) = f × vel(t) + h] for various subgroups of PC SS during gain-increase SPA (A,C,E) and gain-decrease SPA (B,D,F). (A,B) Show the median/quartile values of the velocity coefficient for the four bins covering the course of SPA for the entire population of PC SS during gain-increase SPA (A) and gain-decrease SPA (B). (C,D) Show the changes of the velocity coefficient b for excitatory PC SS during gain-increase SPA (C) and gain-decrease SPA (D). (E,F) Show the changes of the velocity coefficient for inhibitory PC SS during gain-increase SPA (E) and gain-decrease SPA (F). The significance of changes of the velocity coefficient during the course of both forms of SPA was assessed with Friedman ANOVAs (see p-values on top of plots). Velocity coefficients in this figure were computed for Δ = 15 ms.

