
Figure 3.
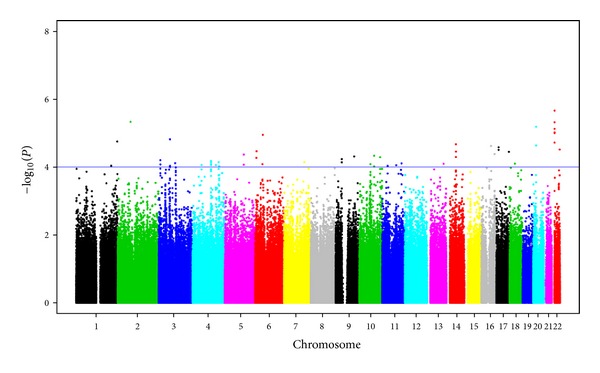
Manhattan plot showing the genome-wide association P values with lupus anticoagulant (LAC). Blue line indicates P = 1E − 04.
Official websites use .gov
A
.gov website belongs to an official
government organization in the United States.
Secure .gov websites use HTTPS
A lock (
) or https:// means you've safely
connected to the .gov website. Share sensitive
information only on official, secure websites.
Manhattan plot showing the genome-wide association P values with lupus anticoagulant (LAC). Blue line indicates P = 1E − 04.