Figure 4.

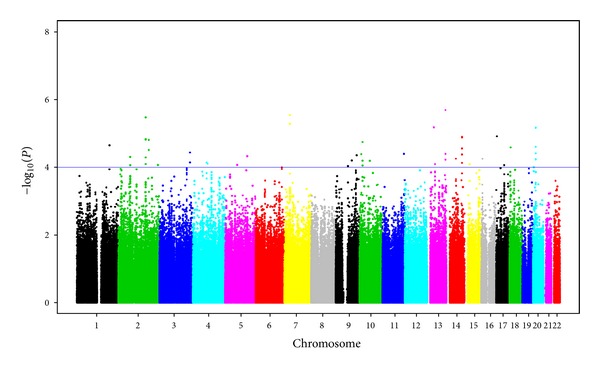
Manhattan plot showing the genome-wide association P values with anti-β 2 glycoprotein I antibodies (Anti-β 2GPI). Blue line indicates P = 1E − 04.

Manhattan plot showing the genome-wide association P values with anti-β 2 glycoprotein I antibodies (Anti-β 2GPI). Blue line indicates P = 1E − 04.