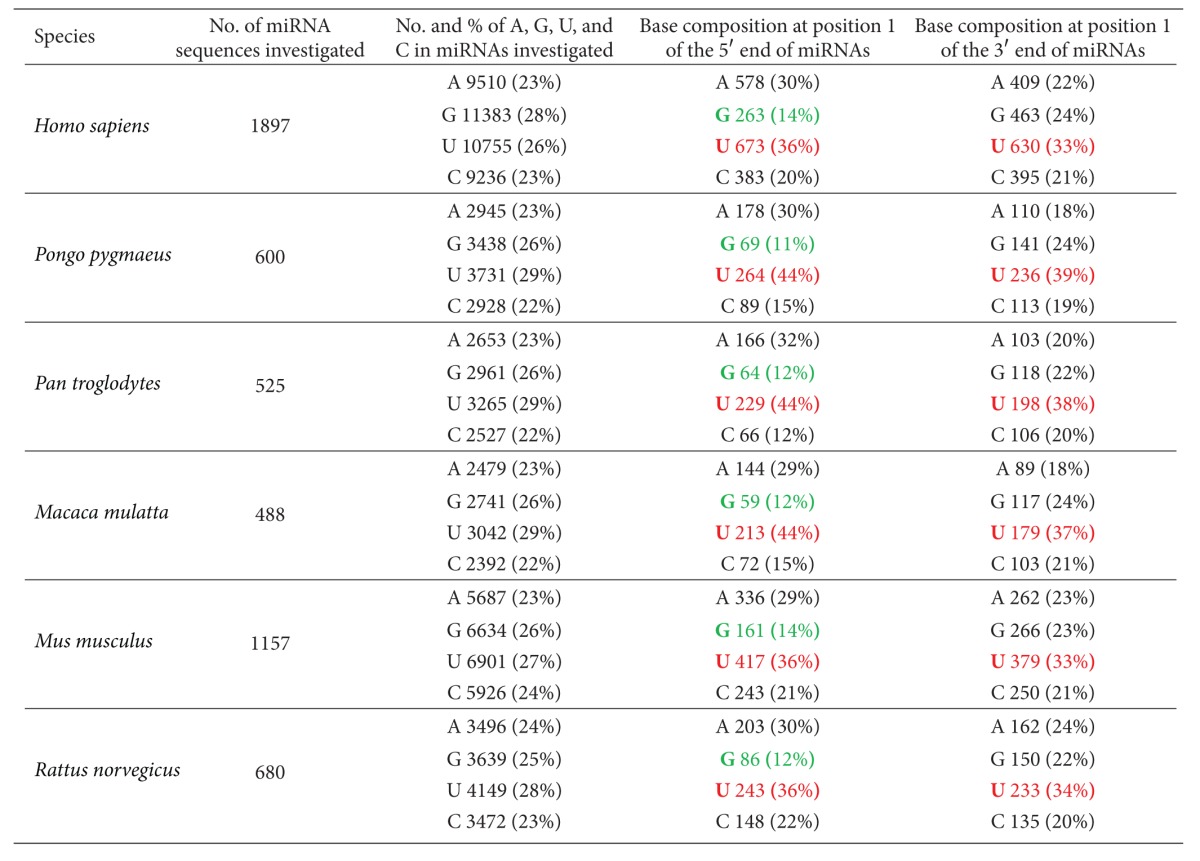
Table 1.
Total base composition and base composition at position 1 of both ends of mature miRNAs in six mammalian species. Bases shown in red represent the most frequent residues in position 1 of both ends of the miRNAs, whereas bases in green indicate the least frequent residues in position 1 at the 5′ end of these miRNAs.

|
