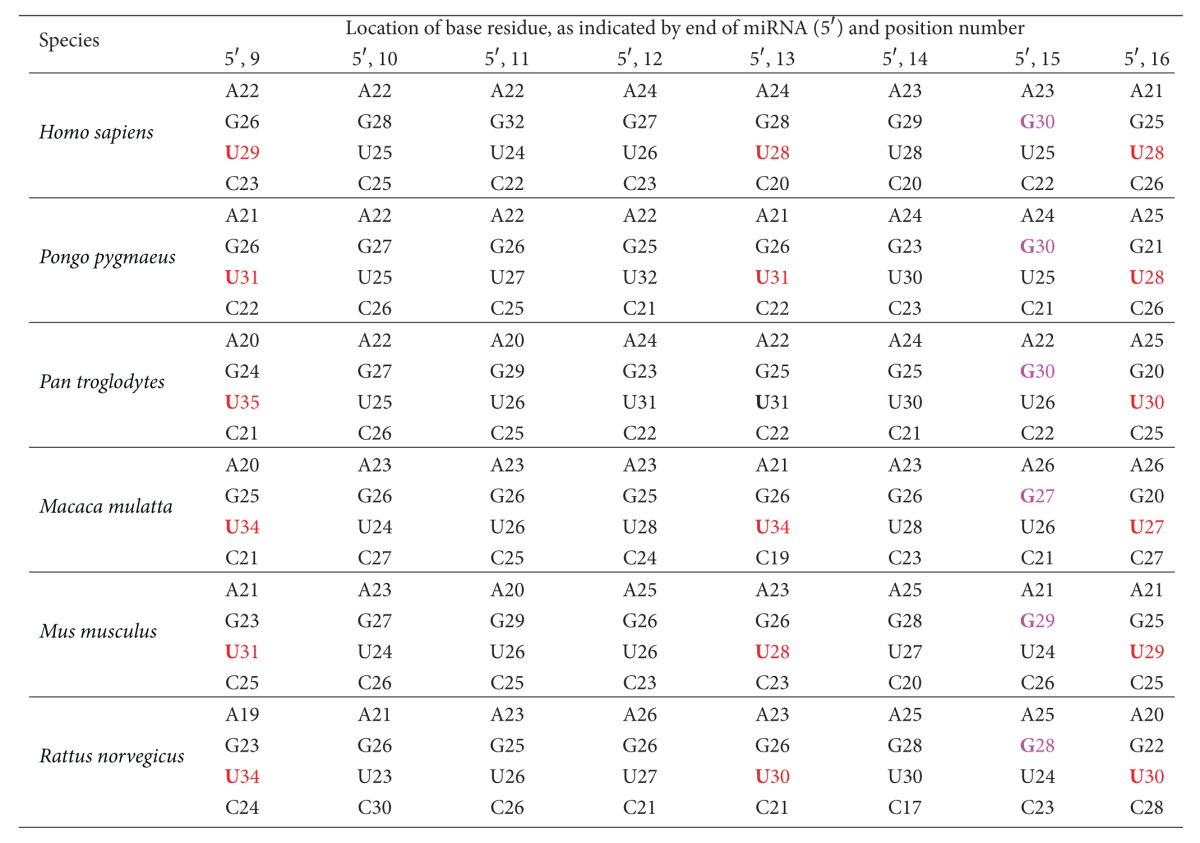
Table 3.
Percentages (%) of A, G, U, and C in every mature miRNA of each species studied. This table contains base composition information for the ninth-through-sixteenth nucleotides from the 5′ end of the miRNAs. Bases shown in red are the most favored residues at positions 9, 13, and 16 of the 5′ end; bases in magenta are the most favored residues at position 15 of the 5′ end of the miRNAs examined.

|
