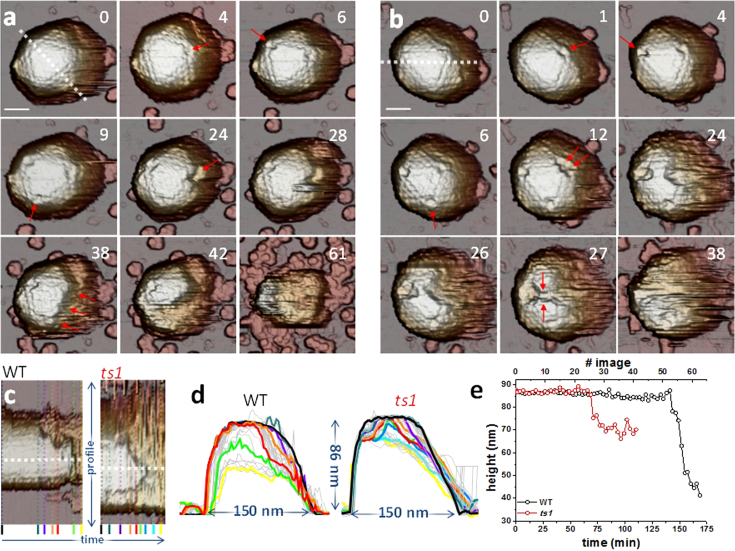
Figure 2. Mature and immature adenovirus disruption by material fatigue.
(a and b) Selected individual frames along the disassembly process of one WT (a) and one ts1 (b) virion. Movies S1 and S3 of SI show complete image datasets for these two viruses. Penton vacancies are highlighted with arrows. The numbers refer to the position of the frame on the corresponding movie. In (a), frame 38, the arrows indicate the crumbling direction. In (b), arrows in frame 27 indicate coalescence of voids. Scale bars correspond to 46 nm and 40 nm for WT and ts1, respectively. (c) Kymographs of the profiles of WT and ts1, as indicated, corresponding to the white dashed lines in frames #0 of (a) and (b). (d) Transversal profiles obtained from (c) showing the shape evolution of WT and ts1 virus. Colored curves denote profiles corresponding to same colored profiles in (c). The remaining profiles are depicted in grey. (e) Evolution of the maximum height of the WT and ts1 particles along time, obtained at the white dotted profiles in (c).

