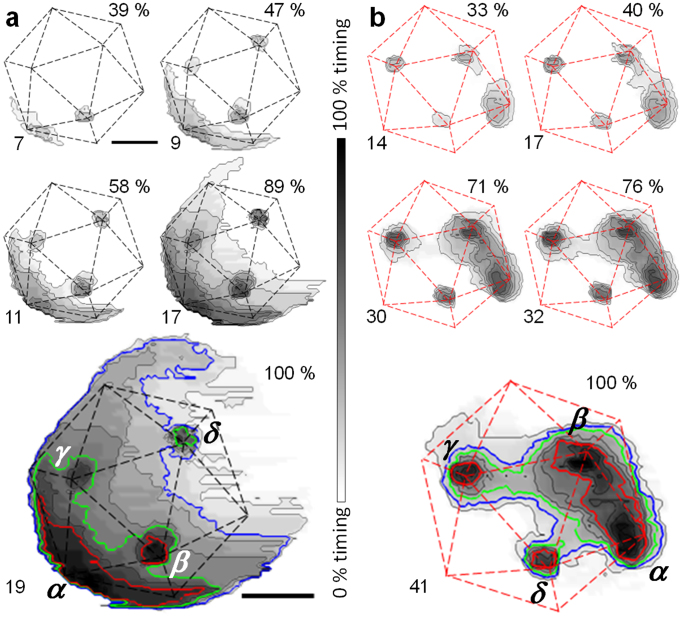
Figure 5. Time cumulative disruption maps (TCDMs).
Disruption maps for WT (a) and ts1 (b) virions. The elapsed time in minutes corresponding to the whole grayscale is 50 min in (a) and 118 min in (b). The scale bar corresponds to 48 and 40 nm for (a) and (b), respectively. Red contour plots indicate areas removed early (32% and 43% of the elapsed time for (a) and (b), respectively). Green contour plots indicate areas removed at medium times (55% in (a), 74% of the elapsed time in (b)). Blue contour plots indicate areas removed late (84% and 83% of the elapsed time). See also movies S1–S5 of SI and Fig. S6.

