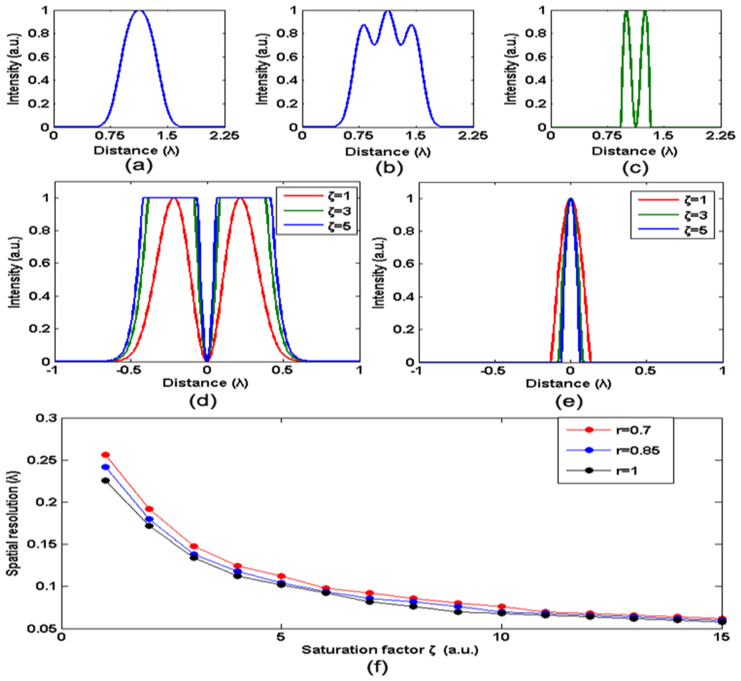
Figure 2. Simulated FED imaging.
Normalized line intensity profiles of the (a) confocal, (b) negative confocal, and (c) FED images for two nanoparticles separated by λ/4. Line profiles of PSF for (d) negative confocal and (e) FED imaging under different saturation factors:  (red curve),
  (green curve), and
  (blue curve). (f) Attainable resolution of FED, in units of illumination beam wavelength, as a function of the saturation factor
  under different subtractive factors: r = 0.7 (red curve), r = 0.85 (blue curve), and r = 1 (black curve). All the simulated results are presented with an objective lens of NA = 1.4.

