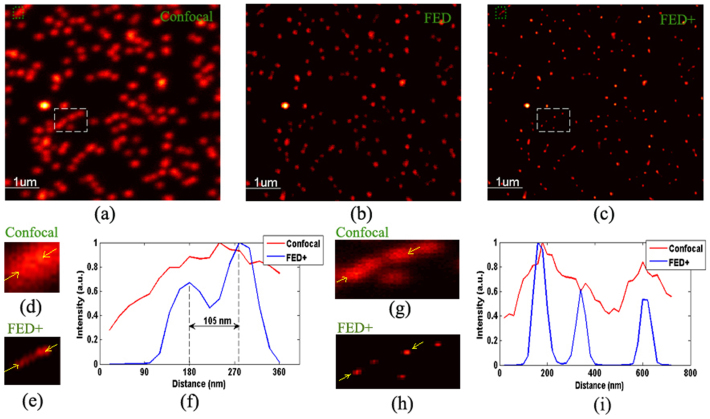
Figure 4. Fluorescent nanoparticle imaging by FED.
(a) Confocal image. (b) FED image with subtractive factor r = 0.75. (c) FED+ image. (d) Magnified view of data indicated by green box in (a). (e) Magnified view of data indicated by green box in (c). (f) Normalized intensity profiles along lines indicated by yellow arrows in (d) and (e). (g) Magnified view of data indicated by white box in (a). (h) Magnified view of data indicated by white box in (c). (i) Normalized intensity profiles along line indicated by yellow arrows in (g) and (h).

