
Figure 4.
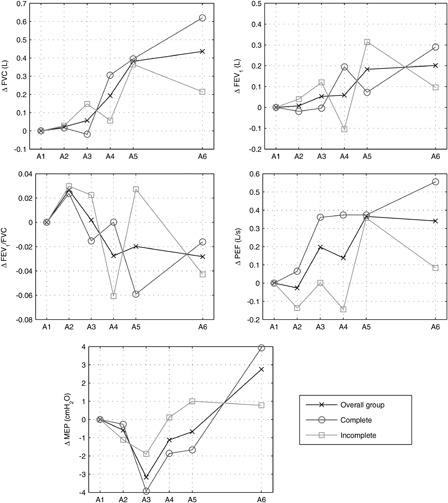
Mean results for the overall group, subjects with incomplete tetraplegia and subjects with complete tetraplegia. Results are presented as absolute change relative to the first assessment session A1.
Official websites use .gov
A
.gov website belongs to an official
government organization in the United States.
Secure .gov websites use HTTPS
A lock (
) or https:// means you've safely
connected to the .gov website. Share sensitive
information only on official, secure websites.
Mean results for the overall group, subjects with incomplete tetraplegia and subjects with complete tetraplegia. Results are presented as absolute change relative to the first assessment session A1.