Figure 1.
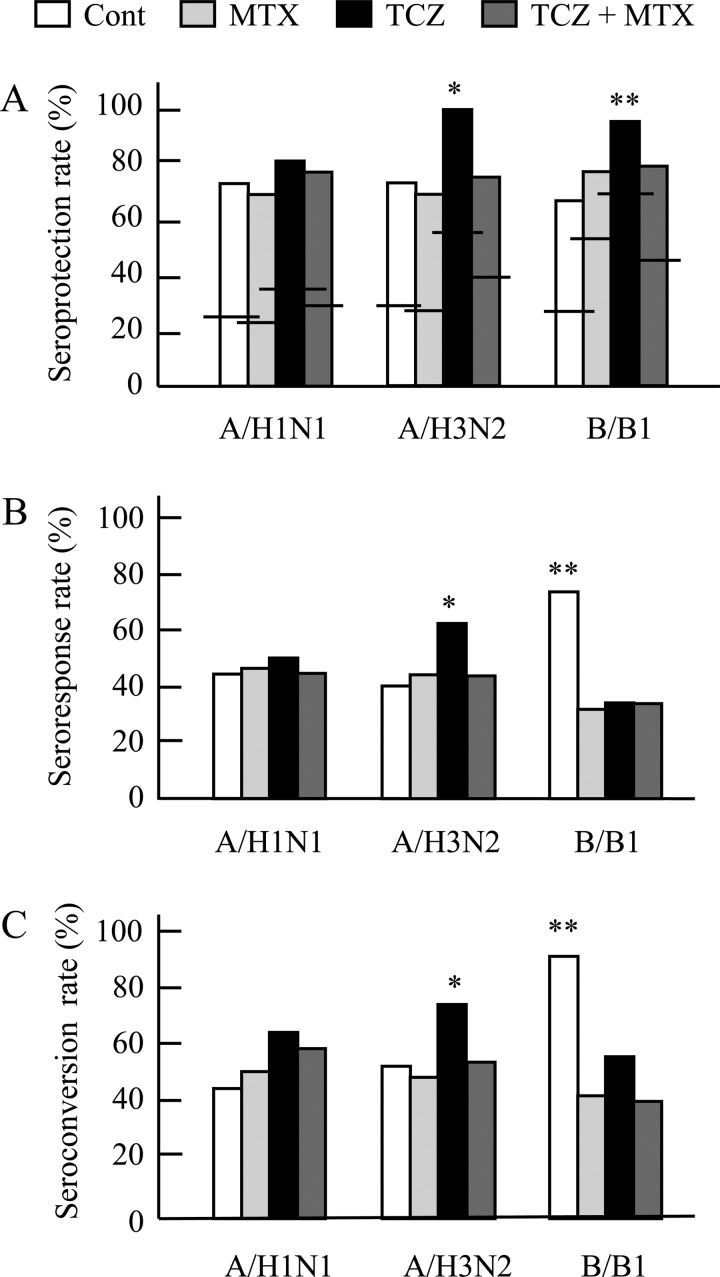
(A) Seroprotection rates for three influenza strains in the RA treatment groups prior to and after influenza vaccination. Horizontal bars represent levels of prevaccination protection rates for each influenza strain. *p=0.006 (TCZ vs Cont), p<0.0005 (TCZ vs MTX) and p=0.001 (TCZ vs TCZ+MTX). **p=0.007 (TCZ vs Cont, TCZ vs MTX) and p=0.023 (TCZ vs TCZ+MTX). (B) Seroresponse rates for three influenza strains in the RA treatment groups. *p=0.04 (TCZ vs MTX). **p=0.0009 (Cont vs MTX), p=0.002 (Cont vs TCZ) and p=0.022 (Cont vs TCZ+MTX). (C) Seroconversion rates for three influenza strains in the RA treatment groups. Seroconversion rates are expressed as percentages of patients with seroconversion out of seronegative patients before vaccination (antibody titres<10). *p=0.032 (TCZ vs MTX). **p=0.003 (Cont vs MTX) and p=0.002 (Cont vs TCZ+MTX). Data were compared using the χ2 test or Fisher's exact probability test. Cont, RA control group; MTX, methotrexate group; RA, rheumatoid arthritis; TCZ, tocilizumab group; TCZ+MTX, combination therapy group.

