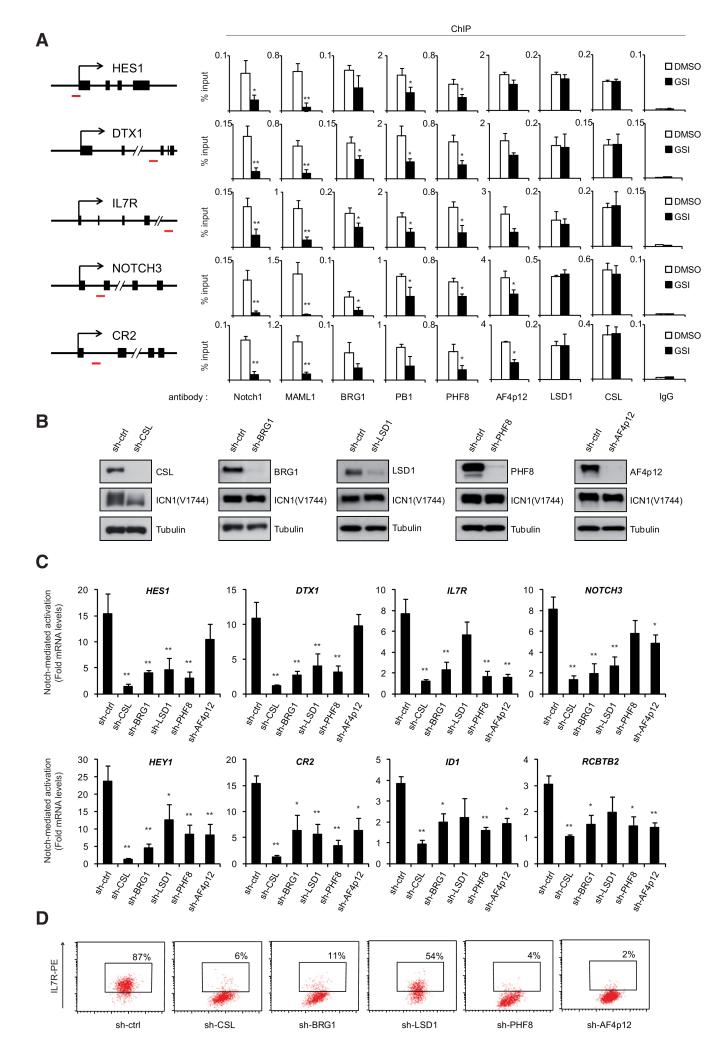
Figure 3. Notch-Associated Cofactors Are Required for Notch Transcriptional Responses.
(A) BRG1, PB1, PHF8, AF4p12, and LSD1 are recruited to Notch-target genes. Chromatin from SupT1 cells treated with DMSO or GSI (1 μM, 8 hr) was subjected to ChIP. The ICN1-binding regions (as determined in Figure S2A) were PCR amplified from the precipitated and input DNA. The position of the PCR amplicons is illustrated in the left panel (red dash). Results are expressed as percentage relative to input. Shown are means ± SD (n ≥ 3).
(B) SupT1 cells were transduced with CSL, BRG1, LSD1, PHF8, AF4p12 specific shRNAs or control shRNA (sh-ctrl). Knockdown efficiency and ICN1 expression were monitored by WB.
(C) BRG1, LSD1, PHF8, and AF4p12 regulate Notch-mediated activation of its target genes in T-ALL. SupT1 cells expressing specific shRNAs (from B) were further treated with DMSO or GSI (1 μM, 24 hr). Notch-induced expression of eight direct target genes (see also Figure S2B) was measured by quantitative RT-PCR. mRNA levels were normalized to GAPDH mRNAs and represented relative to their expression level in the absence of Notch (GSI-treated cells). Shown are means ± SD (n ≥ 3).
(D) Surface expression of IL7R on SupT1 cells 6 days after transduction with the indicated shRNA was analyzed by flow cytometry using anti-IL7RPE antibody. The x axis represents the forward scatter (cell size). The gate and percentage in the dot plots indicate IL7R-positive cells as determined relative to an irrelevant isotype-matched antibody (not shown). See also Figure S2C for IL7R expression in HPB-ALL, TALL1, and DND41. (All panels) *p < 0.05 and **p < 0.01.

