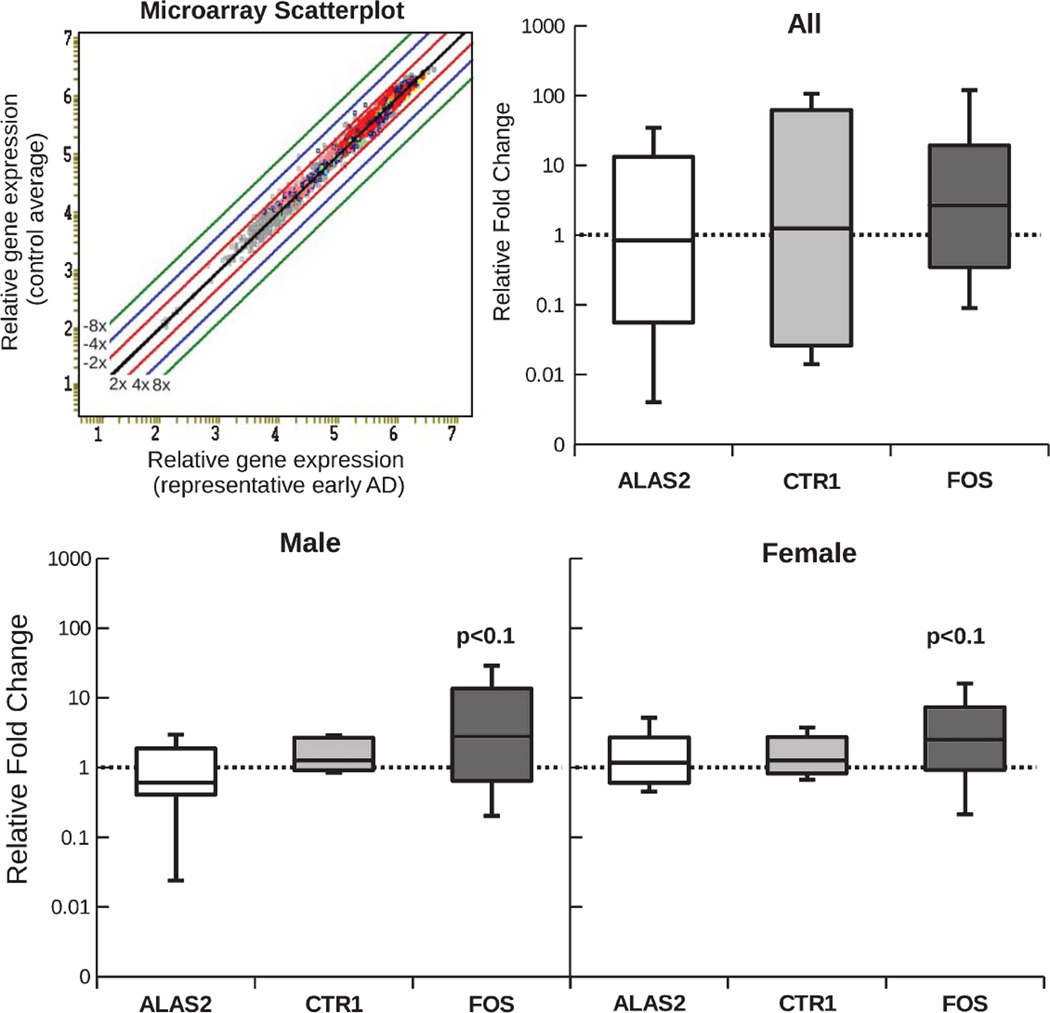
Fig. 3.
The analysis of a representative microarray experiment is shown as a scatter-plot in the top row. It demonstrates that very few genes are differentially expressed in early AD (no fold-change >2). mRNA expression of three genes of interest was further validated using qRT-PCR: ALAS2, CTR1 and FOS. No significant difference in mRNA expression was found for any of the three genes evaluated. (For n see Table 1).

