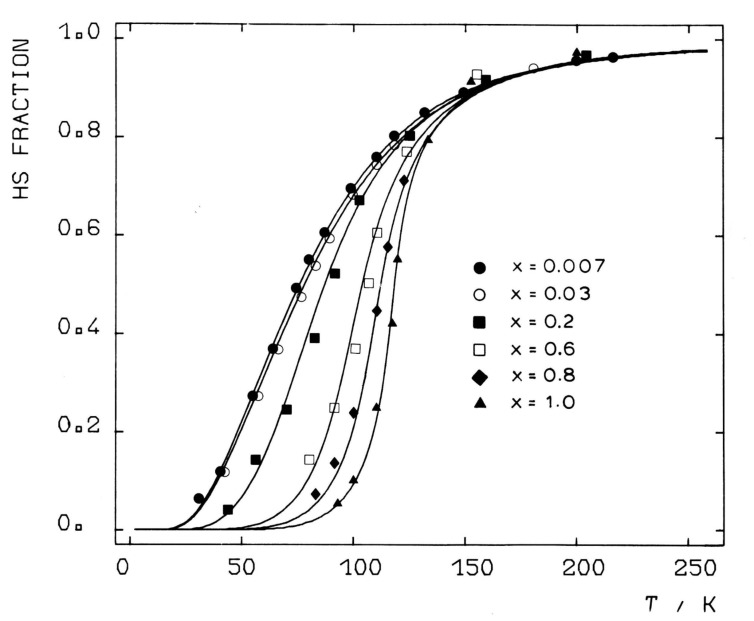
Figure 12.
Temperature dependence of the HS fraction γHS(T), determined from Mössbauer spectra of [Fe(II)xZn1-x(2-pic)3]Cl2·EtOH for different iron concentrations x. The ST curves become more gradual with increasing x due to weakening of the strength of the cooperative interactions. (Reproduced with permission from [27]. Copyright 2003 Wiley-VCH Verlag GmbH & Co. KGaA).

