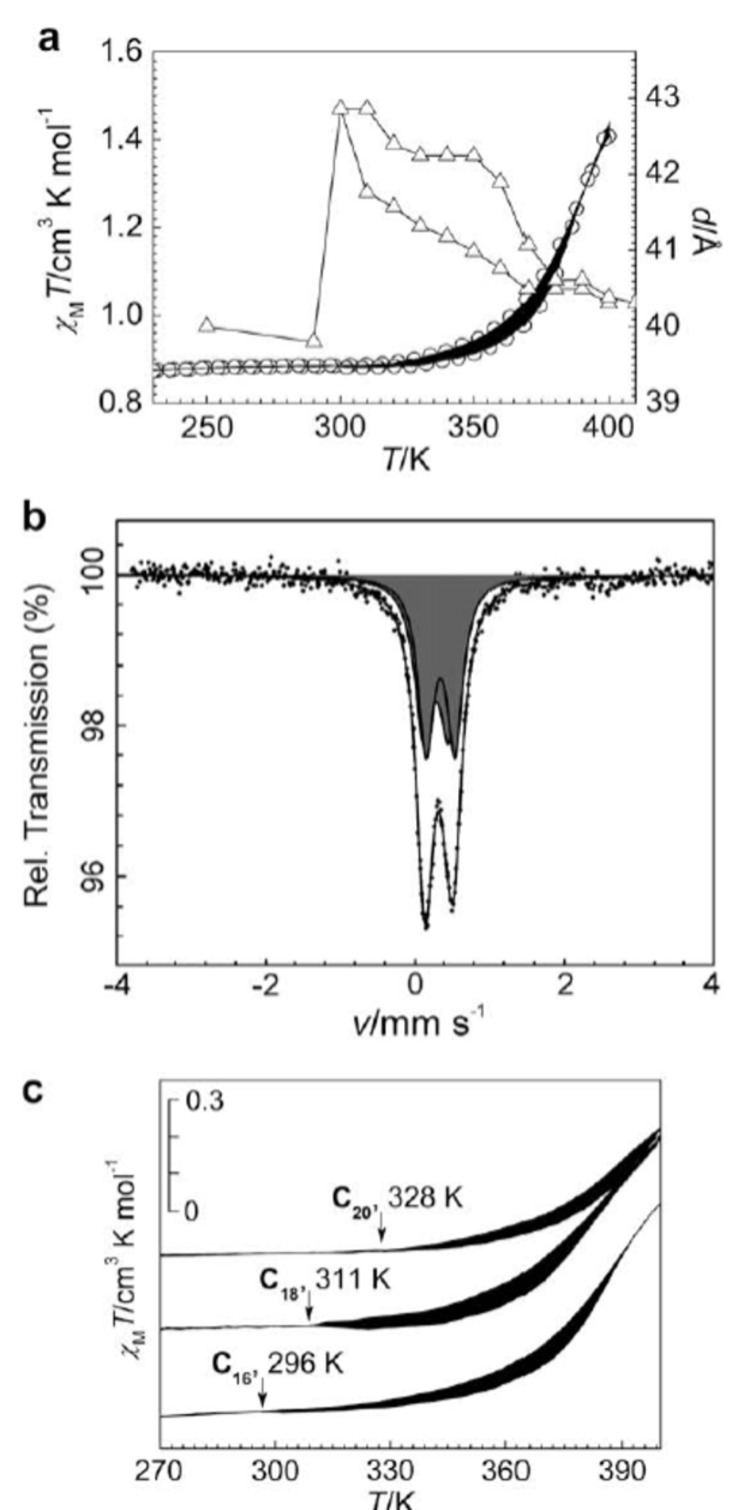
Figure 35.
(a) χMT versus T for [Fe(C16-trenH)]Cl2·0.5H2O and variation of the distance d with temperature (T) deduced from XPRD profiles after following the sequence 310–410–230–410 K. (b) Mössbauer spectra of [Fe(C16-trenH)]Cl2·0.5H2O measured at 80 K (HS doublet: light grey; LS doublet: dark grey). (c) χMT versus T for [Fe(Cn-trenH)]Cl2·0.5H2O (n = 16, 18 and 20), arrows indicate the temperatures at which the heating and cooling curves diverge. The black areas indicate the hysteresis loops. (Reprinted with permission from [394]. Copyright 2008 American Chemical Society).

