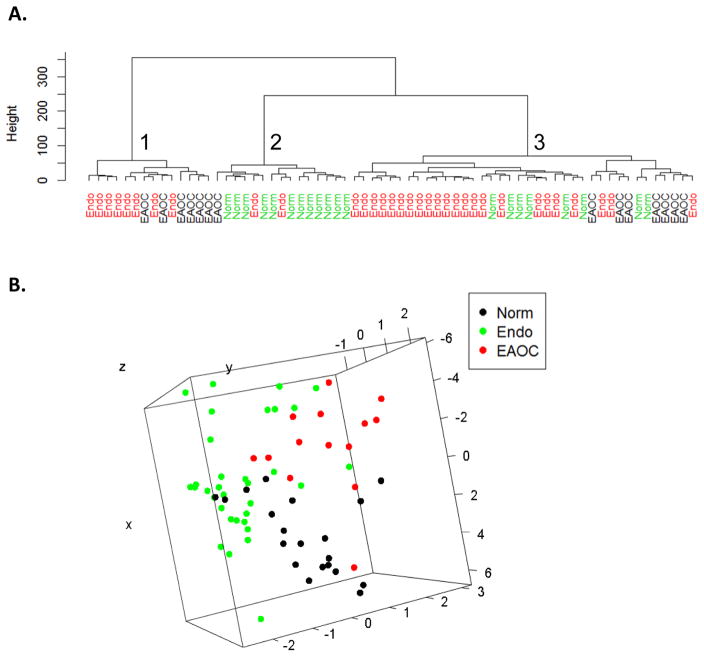
Figure 1.
Plasma miRNA expression profiles can distinguish different disease categories. A) Unsupervised hierarchical clustering was applied to miRNAs with < 30% missing values in healthy controls, endometriosis, and EAOC samples (n=20, 33, and 14, respectively). Different distance measure and link were explored. Samples are classified into three clusters based on the expression signature of 23 plasma miRNAs. B) Principal component analysis was applied to markers with adjusted p value < 0.2 in either one of the three groups’ pair-wised comparisons. First three components were used for the three-dimensional plot. Norm, healthy controls; Endo, endometriosis.

