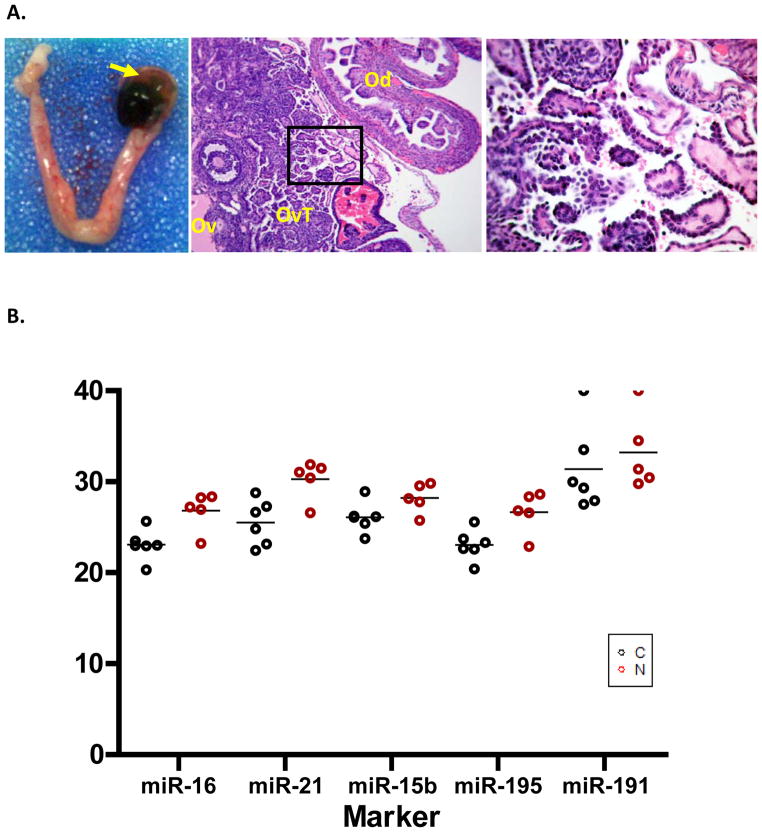
Figure 4.
The plasma miRNA expression signature that differentiates healthy controls from EAOC patients can be detected in a mouse endometrioid ovarian cancer model. A) Left panel shows ovarian tumor at the Ad-Cre injected site (arrow), but no tumor formation seen on non-injected left ovary. Middle panel is 10X HE staining of a cross section of mouse ovarian tumor with ovary (Ov), oviduct (Od), and ovarian tumor (OvT). Right panel shows magnified image of ovarian tumor with endometrioid histology (40X). B) Expression of orthologous miRNAs in healthy mice (n=5) and mice with EAOC (n=6). Four out of the five miRNAs are significantly upregulated in most of the mice with EAOC as compared to normal (p = 0.00009, 0.000433, 0.000209, and 0.00014 for miR-16, 21, 15b, and 195, respectively; student’s t-test), similar to the profiles in human EAOC samples. miR-191 did not reach statistical significance, although there is also a trend that expression of plasma miR-191 is elevated in EAOC mice compared to that of in normal mice. Equal amount of RNA extracted from mouse serum was used for RT and qPCR. The raw CT values were plotted because currently there is no consensus on endogenous plasma miRNA in mouse that can be used for normalization. C, mice with EAOC tumors; N, normal control mice.

