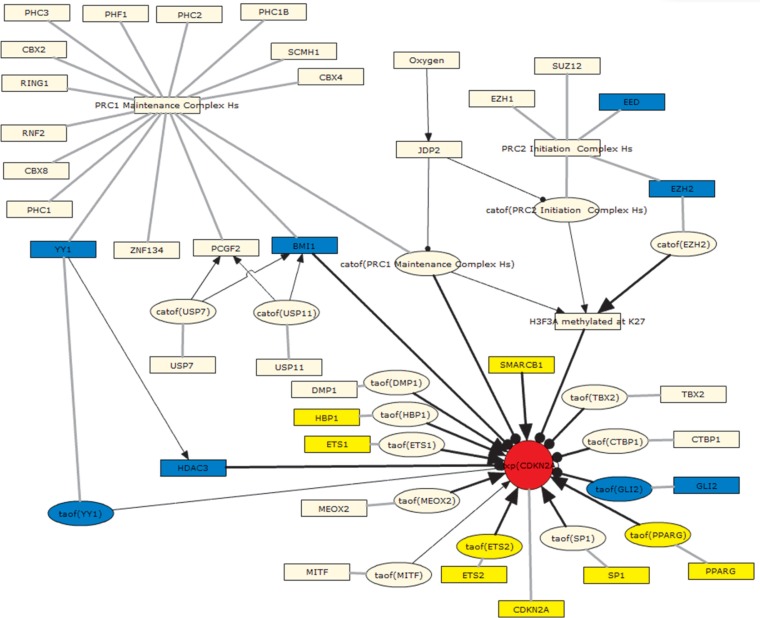
Figure 4.
Graph showing the regulation of CDKN2A expression submodel as depicted using the BEL Framework and colored according to the GSE28464 test data set.
Notes: Yellow = predicted increase in abundance or activity; blue = predicted decrease in abundance or activity; red = observed increase in mRNA expression.
Abbreviations: catof(X), catalytic activity of X; exp(X), mRNA expression of X; taof(X), transcriptional activity of X.

