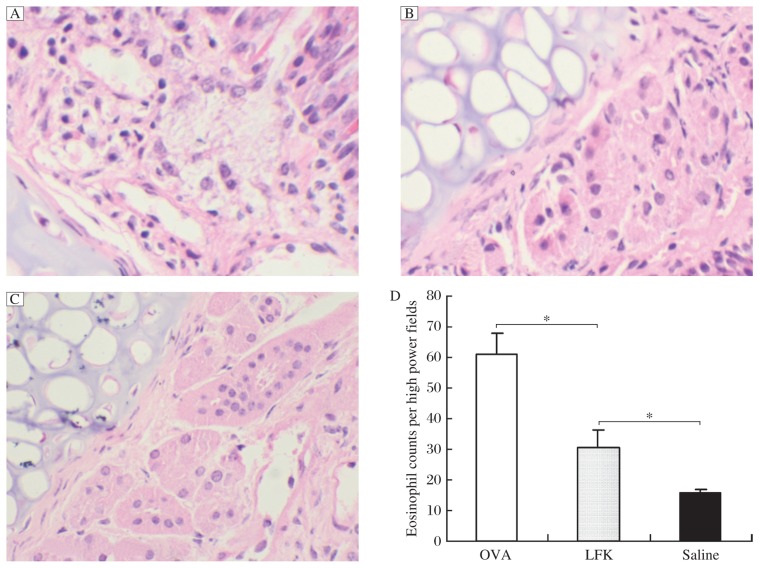
Fig. 4. Representative H&E stained sections of the nasal turbinate tissue of the ovalbumin (OVA) group (A), LFK-fed group (B), and saline control group (C) (magnification, ×200).
Nasal mucosa samples were anatomically separated on d 41, fixed with 10% formalin for 24 h, decalcified in EDTA for 1 week, dehydrated, and embedded in paraffin. Increased eosinophilic infiltration in the nasal submucosa and lamina propria was apparent in the nasal turbinate tissue of the OVA control mice compared to that of the saline control mice, whereas the eosinophilic cellular infiltrate was decreased in the LFK-fed group compared to the OVA group. D: The statistical analysis of the number of eosinophils in three groups (n = 4). Each column and vertical bar shows mean±SEM. *P < 0.05.

