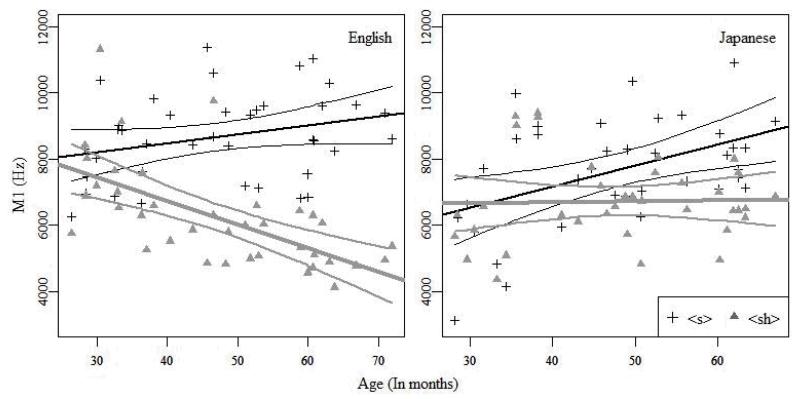
Figure 3.
Mean M1 values of all the tokens for each individual child plotted against children’s ages for each target fricative. Best fit lines from linear regression models were overlaid on the data points together with 95 % confidence interval bands. For Figure 3 - Figure 5, the black regression lines and the associated 95% confidence interval bands are for target /s/ and the grey regression lines and 95% interval bands are for target /ʃ/.

