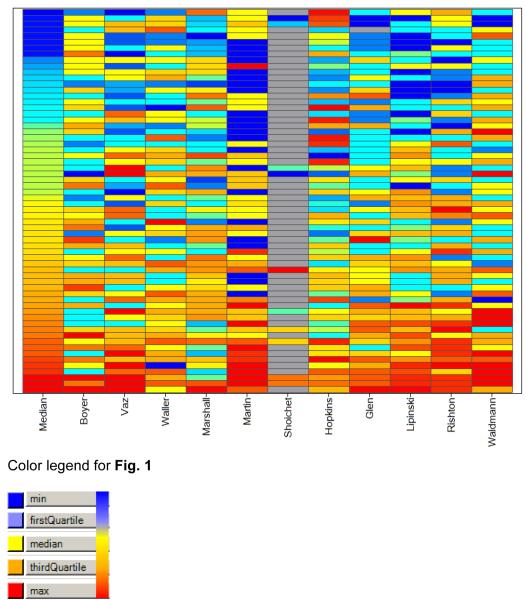
Figure 1.
Heatmap of the confidence scores, by voting member, sorted by the median value. Red and orange indicate high dubiosity, yellow reflects medium values, whereas shades of blue indicate high confidence scores; grey indicates absence of score. The heatmap is sorted by the median score on the vertical axis, and by the research area of the CSG experts on the horizontal axis. The first two columns reflect pharmacokinetics and toxicology, the last four columns reflect a chemical / HTS perspective, whereas the middle five columns are based on cheminformatics tools and experience.

