
Fig. 2.
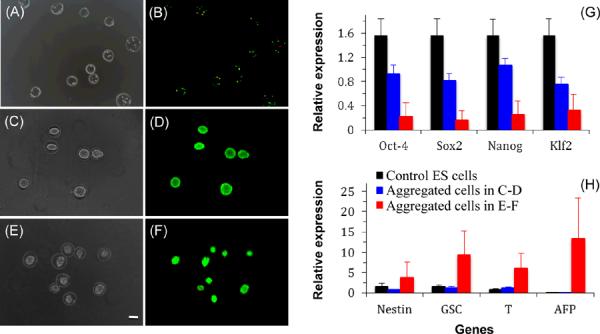
Typical phase and merged fluorescence images of the cell-loaded ACA microcapsules (liquid core) showing live (green) and dead (red) ES cells at day 0 (A–B), after 7-day cutlture in complete ES cell medium (C–D), after 2-day culture in complete ES cell medium flowed by 5-day culture in regular culture medium (E–F) showing the formation of a single cell aggregate in each microcapsule, together with quantitative real time RT-PCR (qRT-PCR) data of four pluripotent genes (G) and four more differentiated genes (H) in the aggregated cells and control ES cells: Nestin gene for ectoderm; GSC (gooscoid) and T (brachyury) genes for mesoderm; AFP (α-fetoprotein) gene for endoderm; and scale bar (applicable to all micrographs), 100 μm