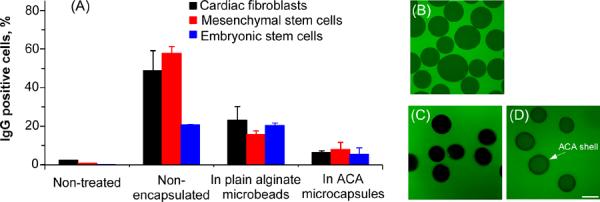
Fig. 3.

Flow cytometry data (A) showing the percentage of IgG bound (positive) cells after incubating cardiac fibroblasts (differentiated cells), C3H10T1/2 mesenchymal stem cells, and R1 ES cells with FITC-IgG (160 kD) overnight and typical confocal fluorescence images of the middle plane through plain alginate microbeads (B) and ACA microcapsules (liquid core, C) after incubating with FITC-IgG (1 hr for B and 12 hr for C) together with that of the ACA microcapsules after incubating with FITC-dextran (4.4 kD) for 1 hr (D): The ACA shell is clearly visible as the dark ring in panel (D) for the ACA microcapsules with a liquid core, but not in (B) for the plain alginate microbeads. Scale bar (applicable to all micrographs): 100 μm
