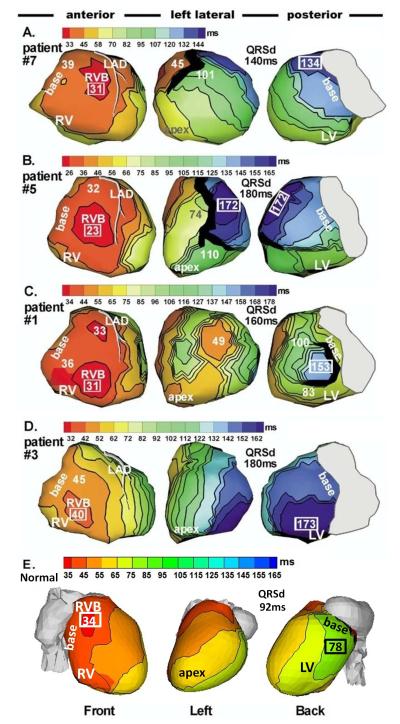
Figure 2.
Epicardial isochrone maps of native rhythm in four representative HF patients (A to D) and in a normal heart (E). Three views are shown for each heart, as indicated at the bottom. Thick black markings indicate conduction block. All HF maps show sequential activation of right ventricle (RV) followed by greatly delayed left ventricular (LV) activation (left bundle branch block, LBBB pattern). RV activation is similar in all patients and has a normal pattern with clearly identified anterior epicardial breakthrough (RVB) location. Details of LV activation vary among patients: A. Apical to lateral-basal conduction. B. Inferior to anterolateral conduction. C. Combined activation from apical, inferior and superior LV. D. Anterior to inferoposterior conduction. Note the variation of region of latest LV activation among the four HF hearts. E. Normal sinus rhythm. Note high degree of ventricular synchrony and absence of conduction delays or block. Numbers indicate activation times (from QRS onset) in milliseconds. QRSd = QRS duration (Adapted from reference 32, with permission).

