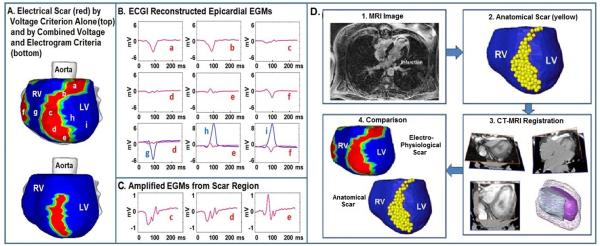
Figure 3.

Images of post-MI electrical and anatomical scar. A. Electrical scar is shown in red (left anterior oblique view). Top image is based on low voltage electrograms only. Bottom image includes the electrograms fractionation criterion. B. Representative electrograms from the scar (a-f, red) and outside the scar (g, h, i; blue). All scar electrograms are of low magnitude; electrograms c, d, and e are also fractionated, as can be easily appreciated from the expanded scale of panel C. Bottom row of panel B shows scar (red) and non-scar (blue) electrograms on the same scale to demonstrate the magnitude difference. D. Low voltage electrical scar (red) is compared to MRI-imaged anatomical scar (yellow). EGM = epicardial electrogram. From reference 51 with permission.
