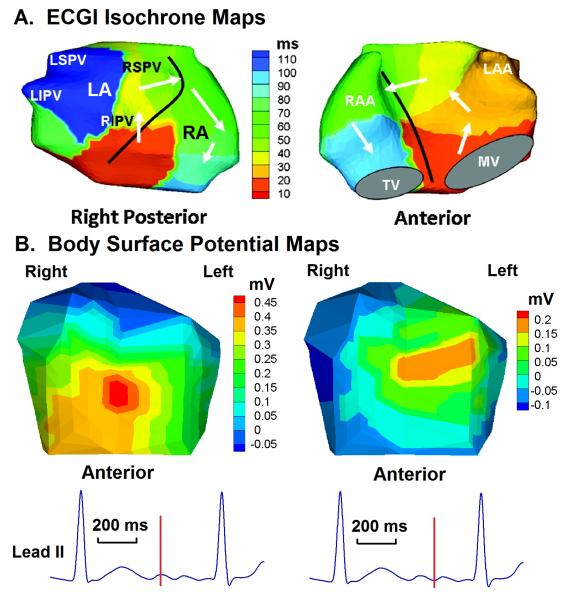
Figure 6.
Paroxysmal atrial fibrillation. A. A single bi-atrial spiral wave (rotor) drives the arrhythmia (white arrows). 100 ms of AF are depicted in the map (right posterior and anterior views). Black line marks the inter-atrial septum. B. Body surface potential maps at the two instances during AF marked on the ECG lead II at the bottom. Note the low voltages and simple (single-maximum) potential distribution, a consequence of the smoothing effect of the torso volume conductor. LSPV = left superior pulmonary vein. LIPV = left inferior pulmonary vein. RSPV = right superior pulmonary vein. RIPV = right inferior pulmonary vein. RA = right atrium. RAA = right atrial appendage. LA = left atrium. LAA = left atrial appendage. TV = tricuspid valve. MV = mitral valve. Online Movie II shows this repetitive pattern. Adapted from reference 56 with permission.

