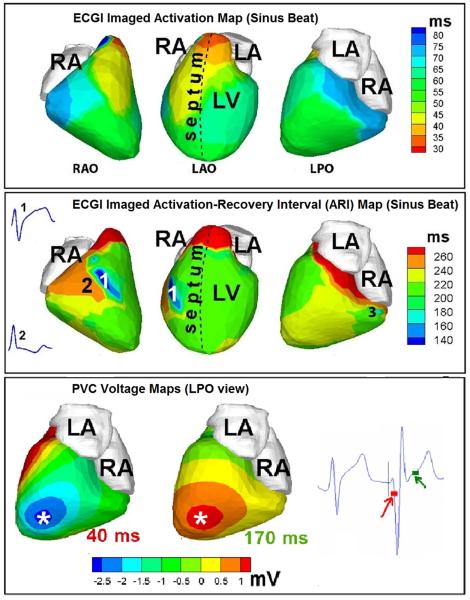
Figure 8.
Abnormal repolarization substrate in early repolarization syndrome. Top row: Activation isochrone maps during a sinus beat shown in three views (from left to right: right anterior oblique, left anterior oblique, left posterior oblique). Middle row: Repolarization ARI maps for the same sinus beat. Insets show two representative electrograms: (1) from the dark blue area with unusually short ARI, and (2) from an adjacent area. Bottom row: ECGI epicardial potential maps during early activation (40 ms, left) and at the start of repolarization (170 ms, right) of a PVC beat. The time points of the potential maps are shown on an ECG trace to the right of the maps. PVC = premature ventricular complex. Adapted from reference 66 with permission.

