Figure 2.
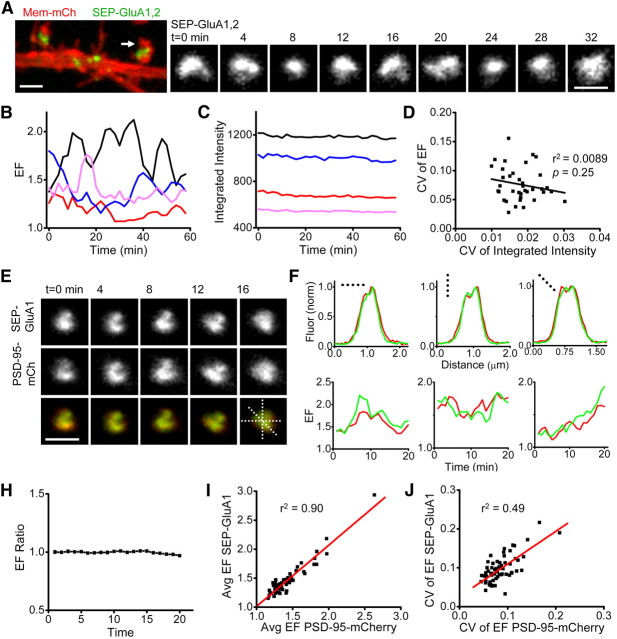
Morphology of AMPAR clusters is continuously dynamic and coordinated with morphology of the PSD. A, Confocal image of a region of dendrite (left) from a neuron expressing Membrane-mCh and both SEP-GluA1 and SEP-GluA2. Example synapse (right) is from the spine marked with an arrow. Scale bar, 1 μm. B, Receptor cluster EF (EF = length/breadth) for 4 example synapses imaged every 2 min for 60 min. C, SEP-GluA1,2 fluorescence intensity of the synapses in B. D, CV of EF and of integrated SEP-GluA1,2 fluorescence intensity for all imaged synapses on 1 neuron. The best linear fit to the data (black line) revealed no correlation (r2 = 0.0089, p = 0.25; n = 37 synapses). Group mean r2 = 0.0393, p = 0.11; n = 67 synapses, 4 neurons (data not shown). E, Time-lapse images of a synapse from a neuron expressing PSD-95-mCh and SEP-GluA1. Dashed lines represent regions used for intensity profiles in F. Scale bar, 1 μm. F, Line profiles measuring fluorescence intensity across three different axes from the synapse shown in E. Fluorescence normalized to peak intensity value in that dimension. Red, PSD-95-mCh; green, SEP-GluA1. G, EF over time for PSD (red) and AMPAR cluster (green) measured in three synapses. H, EF ratio (the quotient of PSD EF and receptor cluster EF) calculated at single synapses and averaged for each neuron (n = 4 neurons). I, EF of PSD and AMPAR cluster averaged over time (20 min) for each synapse in a neuron. Average EF values were strongly correlated (group mean r2 = 0.85, n = 4 neurons). J, CV of the EF of PSD and AMPAR cluster calculated for individual synapses (>20 min). The two measures also strongly correlated on a synapse-by-synapse basis (group mean r2 = 0.48, n = 4 cells).

