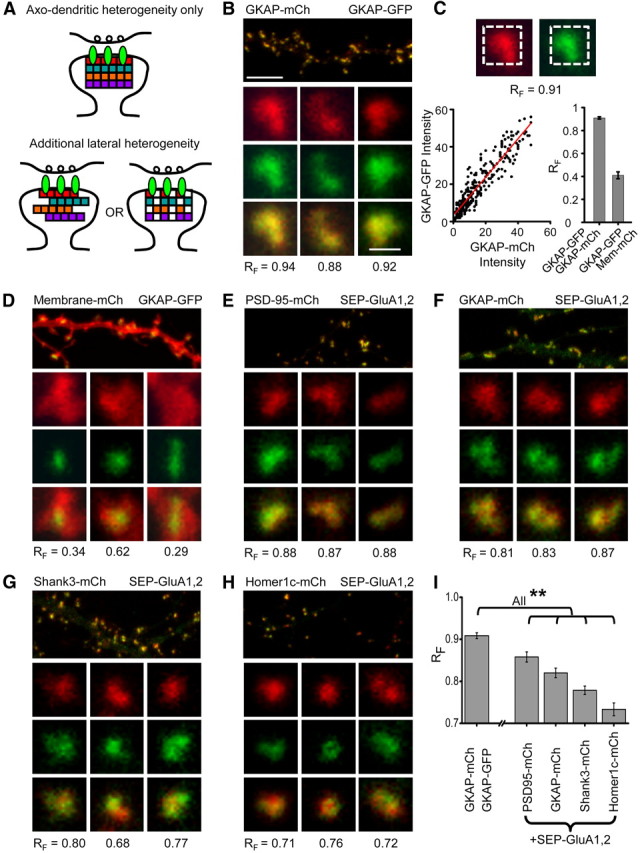
Figure 3.

Subsynaptic AMPAR distribution patterns are diverse and differentially related to individual scaffold components. A, Model summarizing the known lamination of PSD proteins in the axo-dendritic axis (top) and two potential organizations of scaffold proteins that are in addition heterogeneous across the lateral extent of the synapse (bottom). B, Neuron expressing two different GKAP constructs, one tagged with mCh and the other with GFP. For each synapse, RF value shown was calculated as in C. Scale bars, 5 μm (top) and 1 μm (bottom), apply to all panels. C, Procedure for calculating the pixel-wise fluorescence correlation coefficient (RF). Dashed line on the images indicates the region in which correlation was calculated. Red line is the result of regression analysis to determine the best linear fit (bottom left graph). The bounds of RF measurements in this assay were empirically determined (bottom right graph) with interleaved measurements of synapses from neurons expressing GKAP-GFP and GKAP-mCh (upper bound) and GKAP-GFP:Membrane-mCh (lower bound). D, Neuron expressing membrane-mCh and GKAP-GFP. Insets show example spines with PSDs; the spines were generally as large as the cropped image, highlighting that membrane-mCherry is found in synapses but not targeted there specifically. E–H, Pairwise coexpression of the indicated scaffold components and SEP-GluA1,2. I, Mean RF for neurons expressing the indicated constructs. (n = 5, 7, 7, 7, 8 neurons in the order shown). Statistics: Kruskal–Wallis ANOVA (p ≪ 0.001) post hoc pairwise comparisons by Mann–Whitney U test, **p < 0.05.
