Figure 5.
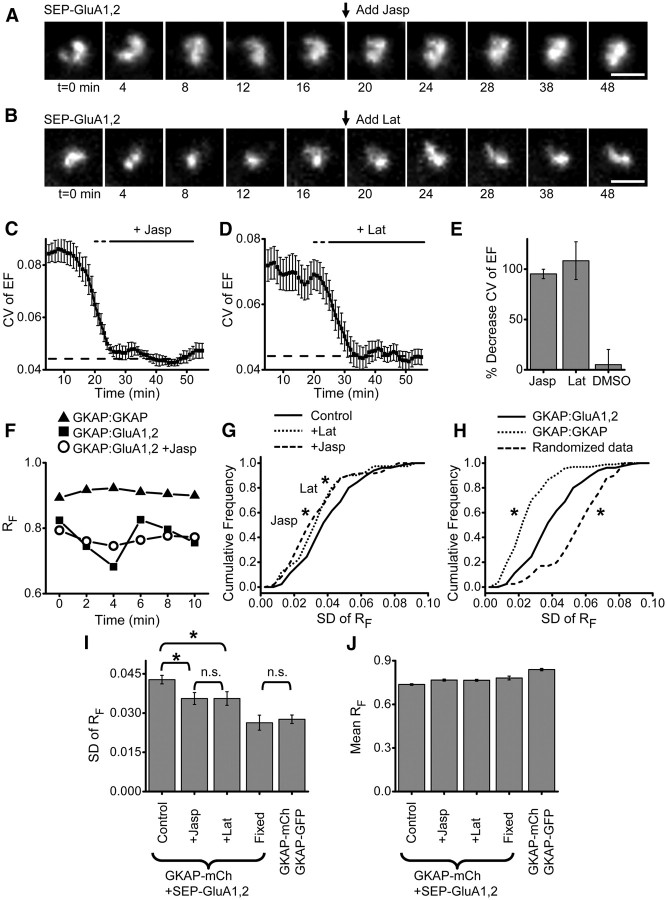
Actin acutely regulates synapse shape and subsynaptic AMPAR distribution. A, Confocal images of an AMPAR cluster (SEP-GluA1,2) over time. Arrow indicates application of 5 μm jasplakinolide. Scale bar, 1 μm. B, Confocal images of an AMPAR cluster (SEP-GluA1,2) over time. Arrow indicates application of 20 μm latrunculin. Scale bar, 1 μm. C, CV of AMPAR cluster EF analyzed in 10 min running bins. Jasplakinolide was added and remained in the bath as indicated by the thick black bar. The thin dashed bar indicates points before the time of drug application that are affected because the binned analysis includes some time points from after the application. Thin dashed line indicates CV of EF measured in fixed cells. n = 6 neurons. D, CV of AMPAR cluster EF analyzed in 10 min running bins. Latrunculin was added and remained in the bath as indicated by the bar. Bars as in C. n = 8 neurons. E, Percentage decrease in CV of EF between 5 and 15 min and 25–35 min bins. F, RF values over time at single synapses from neurons expressing GKAP-mCh + GKAP-GFP (triangle) or GKAP-mCh + SEP-GluA1,2 (square), or GKAP-mCh + SEP-GluA1,2 after application of jasplakinolide (circle). G, H, Cumulative frequency plots of the SD of RF calculated over 10 min (6 time points) at synapses in neurons treated as indicated. For jasplakinolide (5 μm) and latrunculin (20 μm) groups, the treatment was applied 5–10 min before image acquisition so that their effects were complete before t = 0. GKAP-mCh:SEP-GluA1,2: control n (synapses/neurons) = 137/19; jasp n = 73/9, lat n = 41/10, GKAP-mCh:GKAP-GFP n = 98/7. For G, p < 0.05 for latrunculin-treated (dot) compared with control (solid) and p < 0.01 for jasplakinolide-treated (dash) compared with control; for H, p ≪ 0.001 of randomized data compared with experimental data, Kolmogorov–Smirnov test. I, J, SD (I) or mean (J) RF for the groups in G and H. Kruskal–Wallis ANOVA (p ≪ 0.001) post hoc pairwise comparisons by Mann–Whitney U test *p < 0.05, n.s. p ≫ 0.05.

