Figure 6.
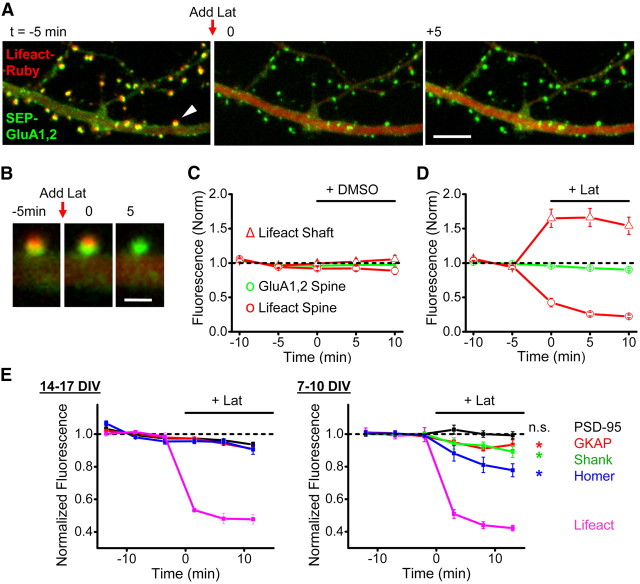
Synaptic AMPAR retention is primarily actin-independent. A, Region from a neuron expressing SEP-GluA1 and SEP-GluA2 along with the probe Lifeact-Ruby that binds F-actin. Latrunculin (20 μm) was applied just before the image stack was acquired for t = 0. Scale bar, 5 μm. B, Spine marked in A by arrowhead imaged at the indicated times. Scale bar, 1 μm. C, D, Normalized fluorescence intensity over time for a group of experiments performed with the indicated treatments of either 0.1% DMSO (C) or 20 μm latrunculin (D). Red traces are Lifeact-Ruby fluorescence measured in spines (circles) or dendrites (triangles). Green traces are SEP-GluA1 fluorescence measured in spines (circles) or dendrites (triangles). n = 8 lat, 6 DMSO. E, Normalized fluorescence intensity measurements for mCh-tagged PSD scaffold proteins or Lifeact-Ruby with 20 μm latrunculin treatment as indicated. Neurons were grown for either 14–17 DIV (left) or 7–10 DIV (right) before imaging. n = 6 neurons for PSD-95, 6 GKAP, 4 Homer, 3 Lifeact (DIV 14–17), and n = 5 PSD-95, 6 GKAP, 7 Shank, 5 Homer, 3 Lifeact (DIV 7–10). For DIV 7–10, p values Mann–Whitney U test comparing baseline to mean of the two values flanking 10 min were 0.83 PSD-95, 0.03 GKAP, 0.007 Shank, and 0.012 Homer.

