
Figure 7.
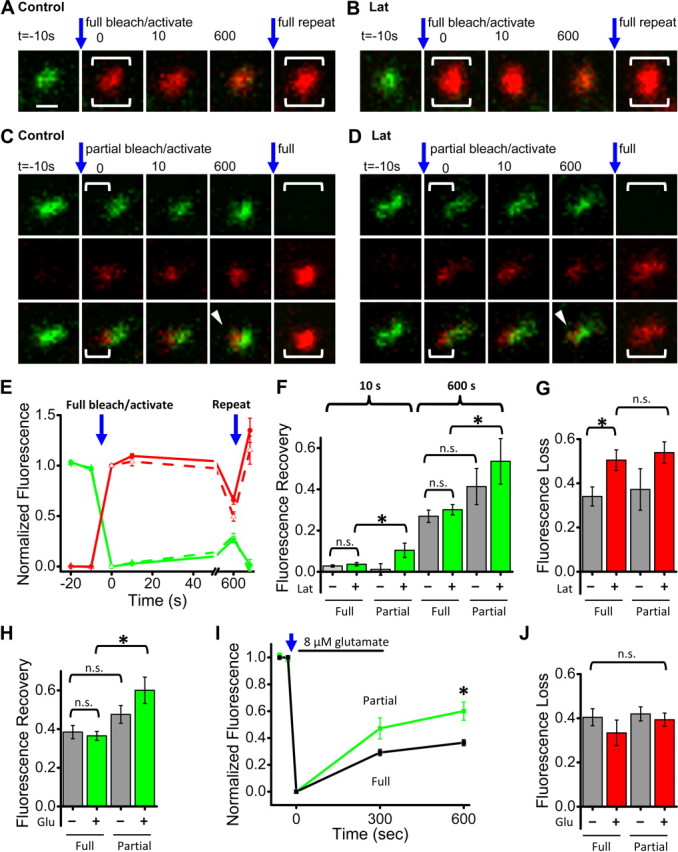
Subsynaptic AMPAR confinement persists even after actin filament depolymerization. A, B, Synapses from neurons expressing SEP-GluA1 and PSD-95-PATagRFP. After acquiring baseline images, a brief 405 nm laser pulse was applied to the full synapse to simultaneously bleach SEP-GluA1 fluorescence and activate PSD-95-PATagRFP fluorescence. A final bleach/activation step was applied to the full synapse after t = 600 s (large bracket). In B and D, neurons were treated with latrunculin (20 μm) for at least 5 min before and during imaging. Scale bar (in A), 500 nm, applies to A–D. C, D, Synapses from experiments conducted as in A and B, except that only a portion of the synapse was targeted (brackets). E, Quantification of normalized SEP-GluA1 (green) and PSD-95-PATagRFP (red) fluorescence over time, for synapses targeted for full photoactivation/photobleaching. Control (solid line, n = 27) or latrunculin treated (dashed line, n = 21). F, SEP-GluA1 fluorescence recovery measured at the indicated time points for either full or partial synapse photobleaching. Gray bars are from untreated neurons and green bars from latrunculin treated. Number of synapses/neurons: Full photobleaching: control 27/11, latrunculin 21/8, Partial photobleaching: control n = 10/6, latrunculin 12/6. *p < 0.05, n.s. not significant. G, PSD-95-PATagRFP fluorescence loss 600 s after photoactivation in either full or partial synapse targeting. Same synapses as in F. Gray bars are from untreated neurons and red bars from latrunculin-treated. *p < 0.05, n.s. not significant. H, SEP-GluA1 fluorescence recovery measured at 600 s for either full or partial synapse photobleaching in control conditions (gray) or with 5 min of 8 μm glutamate application (green). Full photobleaching: control n = 25/15, glutamate 31/12. Partial photobleaching: control 16/10, glutamate 15/7. Kruskal–Wallis ANOVA (p ≪ 0.001) post hoc pairwise comparisons by Mann–Whitney U test *p = 0.001, n.s. not significant. I, SEP-GluA1 fluorescence recovery measured at the indicated time points after full synapse photobleaching in control conditions (black) or with 5 min of 8 μm glutamate application (green). *p = 0.001, as in H. J, PSD-95-PATagRFP fluorescence loss 10 min after photoactivation for full or partial synapse targeting as indicated; gray bars, control, and red bars, glutamate treated. Kruskal–Wallis ANOVA n.s. not significant p = 0.44.