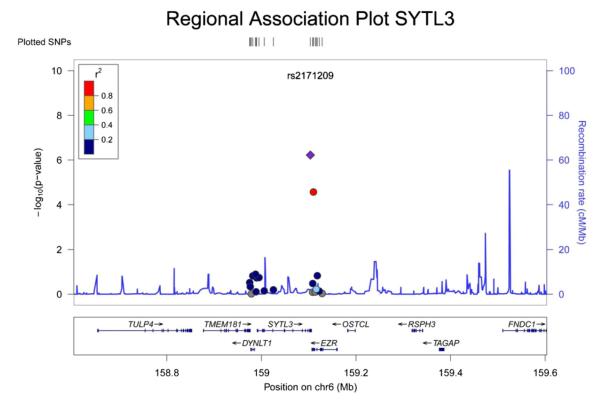
Fig. 1.
This plot shows the p-values for rs2171209, as well as for SNPs in the region of rs2171209, with ABI in a meta-analysis of the discovery studies. The x-axis shows chromosomal location in Mb (chromosome 10), as well as genes residing in this region. The y-axis on the left displays the −log 10(p-value) for each SNP, and the y-axis on the right shows the recombination rate in this region. The top SNP, rs2171209 is represented as a purple diamond, while supporting SNPs and other SNPs in the area are color-coded by linkage disequilibrium with rs2171209 (see r2 linkage disequilibrium legend on the plot). (For interpretation of the references to color in this figure legend, the reader is referred to the web version of the article.)

