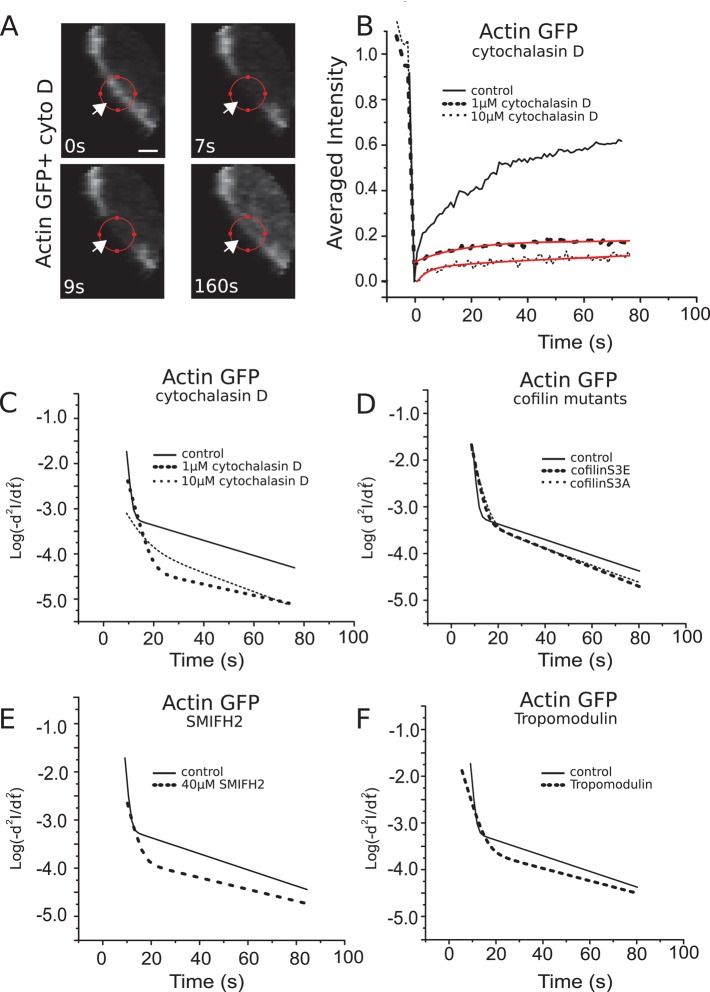
FIGURE 3:
Effects of genetic and chemical perturbations on actin cortex turnover. (A) Consecutive confocal images of a FRAP experiment in a region comprising the actin cortex for a GFP-actin–expressing cell in the presence of 10 μM cytochalasin D. Scale bar, 1 μm. (B) Fluorescence recovery in presence of 1 μM (dashed line, averaged over 12 cells) and 10 μM (dotted line, 11 cells) cytochalasin D and in control cells (solid line). Red lines represent best experimental fits to multiexponential functions. (C–F) Logarithmic acceleration plots (see Materials and Methods) of average fluorescence recovery in the presence of cytochalasin D (C); for cells expressing either constitutively active or a dominant-negative cofilin mutants, respectively, cofilinS3A and cofilinS3E (D); in the presence of the formin inhibitor SMIFH2 (E); and for cells overexpressing the pointed-end capping protein tropomodulin (F). Curves were averaged over at least 10 cells. Solid lines indicate fluorescence recovery in untreated cells expressing GFP-actin.

