FIGURE 2:
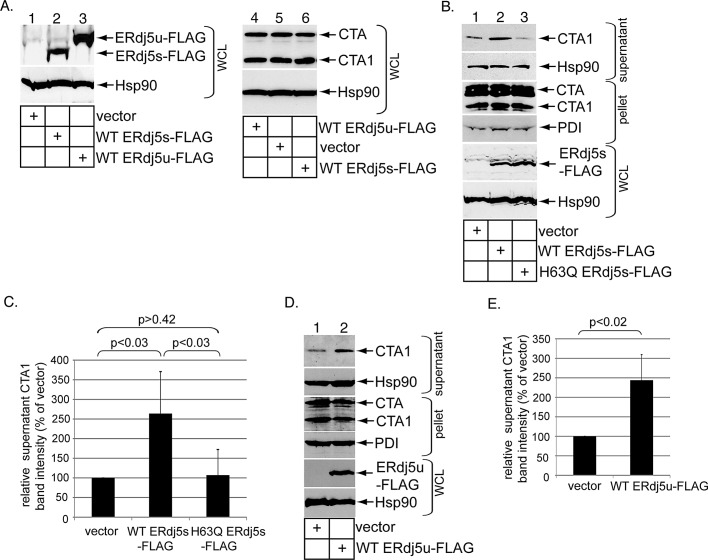
ERdj5 overexpression stimulates CTA1 retrotranslocation. (A) WCLs derived from 293T cells transfected with vector, WT ERdj5s-FLAG, or WT ERdj5u-FLAG and intoxicated with CT (10 nM) were analyzed by immunoblotting using the indicated antibodies. (B) Cells transfected with vector, WT ERdj5s-FLAG, or H63Q ERdj5s-FLAG were incubated with CT (10 nM) for 90 min and subjected to the retrotranslocation assay, as in Figure 1C. The supernatant and pellet fractions and the WCLs were analyzed by immunoblotting with the indicated antibodies. (C) The CTA1 band intensity in (B) was quantified as in Figure 1D. Mean of five independent experiments. A two-tailed t test was used. Error bars: ± SD. (D) As in (B), except only vector and WT ERdj5u-FLAG were transfected. (E) The CTA1 band intensity in (D) was analyzed as in (C). Mean of seven independent experiments. A two-tailed t test was used. Error bars: ±SD.

