FIGURE 1:

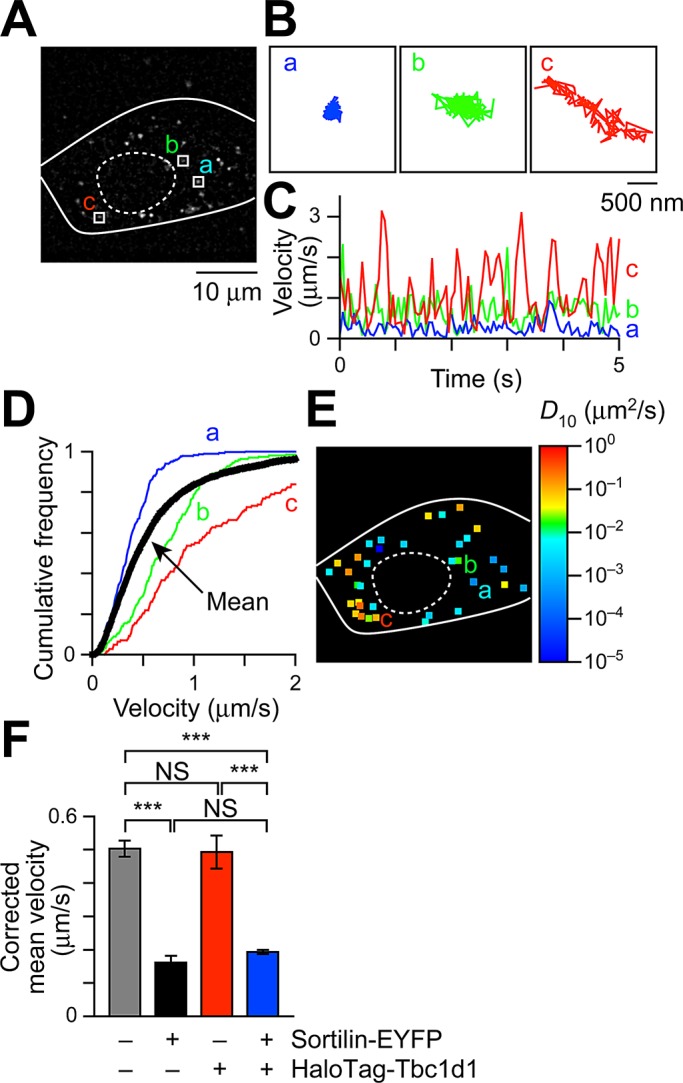
Intracellular GLUT4 nanometry based on single-molecule imaging. (A) Snapshot of QD fluorescence in 3T3L1 fibroblasts. Trajectories (B), velocity vs. time plots (C), and cumulative velocity distributions (D) of three particles shown in A. In D, the mean velocity distribution calculated from all particles in the cell is also shown (black), with error bars omitted for clarity. Mean velocities (in μm/s) of the three particles shown in A are 0.38 (a), 0.50 (b), and 1.13 (c), and the mean velocity of all particles within the cell is 0.62 μm/s. (E) Diffusion coefficient (D10) map in a cell shown in A. The three particles shown in A are also indicated. Right, pseudocolor coding used to represent the diffusion coefficients of the molecules estimated by linear fitting of MSD values (see Materials and Methods). (F) Mean velocities in cells expressing the indicating proteins. The values were obtained from 6–84 cells. ***p < 0.001 by Tukey–Kramer multiple comparison.
