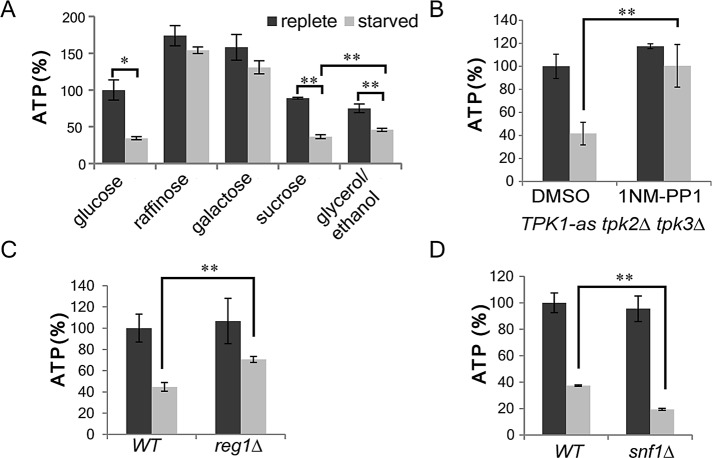
FIGURE 4:
Cellular ATP concentration decrease significantly during glucose starvation and is regulated by glucose repression pathways. (A) Cellular ATP was measured in wild-type cells preadapted to different carbon sources (2% glucose, 2% galactose, 2% raffinose, 2% glycerol/3% ethanol, or 2% sucrose) before and after carbon source withdrawal. (B) TPK1-as tpk2∆ tpk3∆ cells were grown to mid–log phase, incubated with 2 μM 1NM-PP1 or DMSO for 1 h, and then starved. Cellular ATP was measured in cells before and after starvation. ATP concentrations were normalized to cells grown in glucose and treated with DMSO. (C) Cellular ATP was measured in reg1∆ cells before or after glucose starvation. The relative ATP concentrations were normalized to wild-type cells grown in glucose. (D) snf1Δ cells were processed as in C. **p < 0.01, *p < 0.05. Charts show average values and SD.

