FIGURE 5:

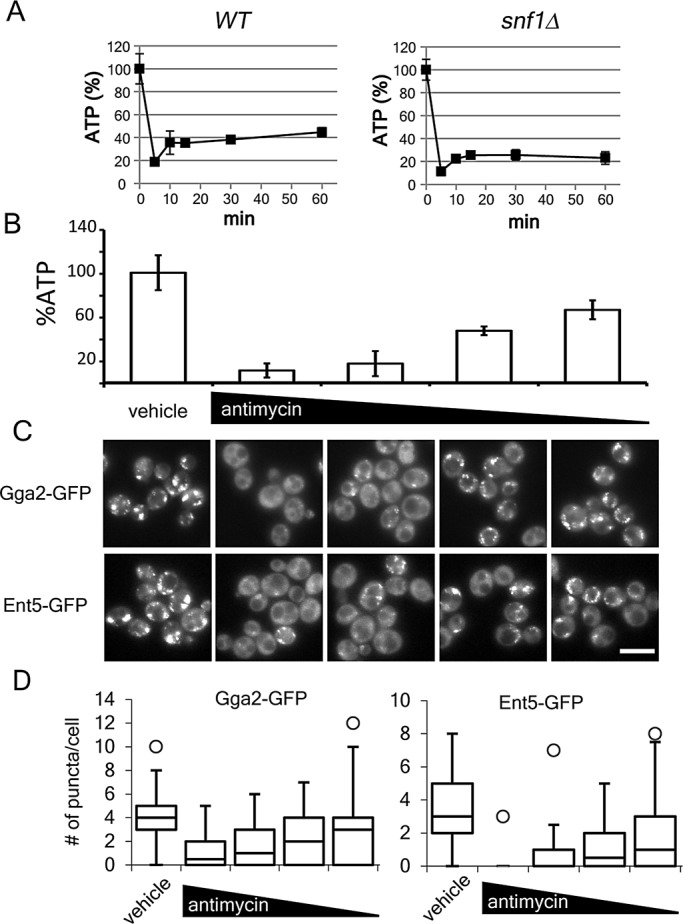
Cellular ATP concentrations correlate with the association of adaptors to membranes. (A) Cellular ATP measured in indicated cells before and after glucose starvation as described in Materials and Methods. (B) Wild-type cells were grown to mid–log phase in galactose and then starved. Various amounts of antimycin A were added to the cells. Cellular ATP measured as described. Charts show average values and SD. (C) Indicated cells were processed as in B and imaged. Scale bar, 5 μm. (D) Quantification of the number of puncta per cell for cells in C. Chart shows box plot of data as described in Figure 1.
