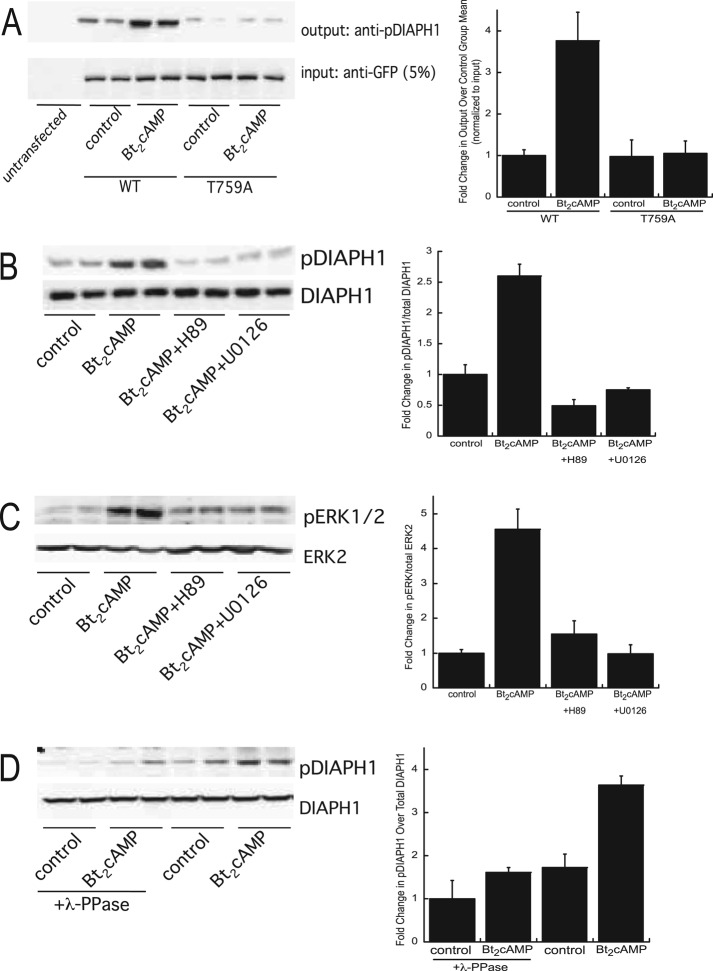
FIGURE 3:
(A) H295R cells were transfected with WT or T759A-mutant pEGFP-DIAPH1 and treated for 30 min with 0.4 mM Bt2cAMP, and lysates were immunoprecipitated using an anti-GFP antibody and protein A/G agarose. Immobilized proteins were washed, separated by SDS–PAGE, and analyzed by Western blotting using an anti–phospho(T759)-DIAPH1 antibody. Five percent of inputs were subjected to SDS–PAGE and Western blotting using an anti-GFP antibody. Left, representative blots; right, densitometric analysis. Graph data represent mean ± SD of three experiments, each in duplicate. (B) H295R cells were pretreated with 10 μM H89 or 10 μM U0126 and then treated with 0.4 mM Bt2cAMP for 30 min. Cell lysates were harvested and separated by SDS–PAGE, followed by Western blotting using anti–phospho(T769)-DIAPH1or anti-DIAPH1 antibodies. Left, representative blots; right, densitometric analysis. Graph data represent the mean ± SD of five experiments, each in duplicate. (C) H295R cells were pretreated with H89 or U0126 and then treated with Bt2cAMP. Cell lysates were harvested and separated by SDS–PAGE, followed by Western blotting using anti–phospho-ERK1/2 or anti-ERK2 antibodies. Left, representative blots; right, densitometric analysis. Graph data represent mean ± SD of five experiments, each in duplicate. (D) Lysates isolated from control or Bt2cAMP-treated cells were incubated with λ-phosphatase and then subjected to SDS–PAGE and Western blotting for pDIAPH1 or DIAPH1. Left, representative blots; right, densitometric analysis. Graph data represent the mean ± SD of two experiments, each in duplicate. In all graphs, asterisks denote statistical significance (p < 0.05) compared with untreated control.

