Figure 3.
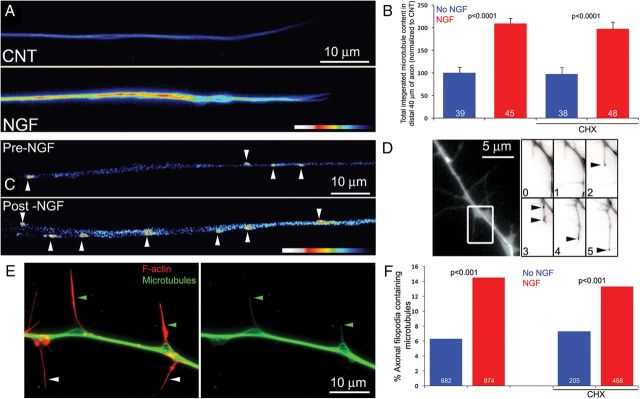
NGF-induced increases in axonal microtubule polymer levels and the localization of microtubules in axonal filopodia are independent of protein synthesis. A, Examples of microtubule levels in control (CNT) and NGF-treated axons (30 min) simultaneously fixed and extracted and stained with anti-α-tubulin. Note that the NGF-treated axons exhibit increased levels of microtubules. B, Quantification of the background subtracted integrated α-tubulin staining intensity in distal axons. CHX treatment did not affect baseline microtubule levels and did not impair the NGF-induced increase. n = number of axons measured is denoted in the bars. Data were analyzed using the Welch's t test. C, Example of EB3 decorated microtubule tips in the same axon pretreatment and 30 min post-treatment with NGF. Individual microtubule tips are denoted by arrowheads. D, Example of EB3-decorated microtubule tip entry into an axonal filopodia. The rightmost squares show the region of the axon emphasized in the subsequent squares (white box). The squares are separated by 1 min intervals and the signal was inverted to increase the ease of detection of microtubule tips. The arrowheads denote the tips of microtubules present in the filopodium/nascent branch. E, Examples of filopodia containing microtubules (green arrowheads) and filopodia devoid of microtubules (white arrowheads). The axon was simultaneously fixed and extracted and labeled to reveal microtubules and actin filaments (F-actin). F, Quantification of the percentage of axonal filopodia that contain one or more microtubules.NGF treatment increases the localization of microtubules in axonal filopodia, and CHX treatment did not affect baseline (p > 0.7) or NGF-induced levels of microtubules in axonal filopodia. Fischer's exact tests performed on raw categorical data.

