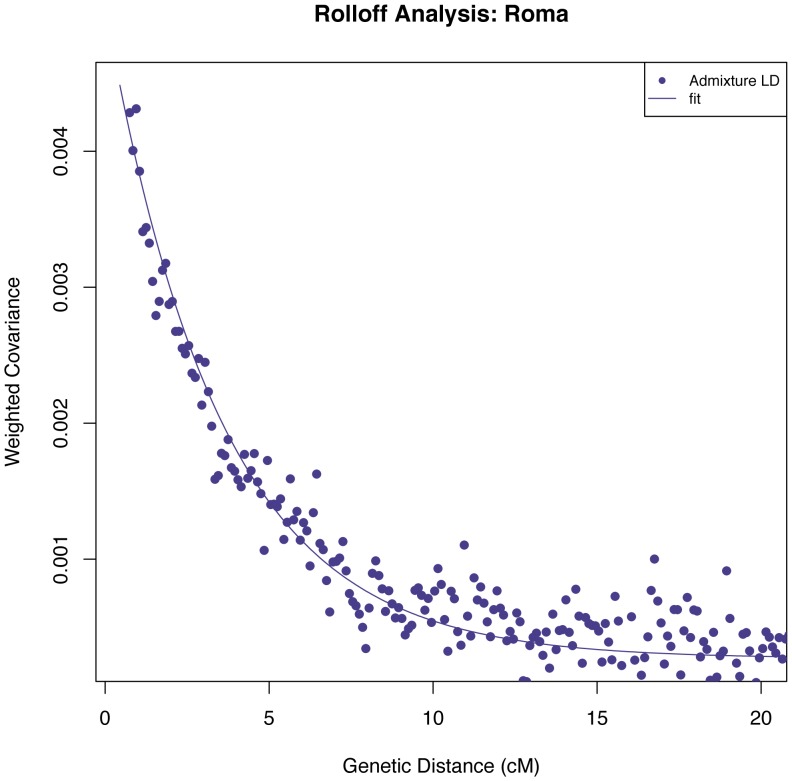
Figure 2. Admixture date estimation.
We performed ROLLOFF (using R(d)) on the Roma samples (n = 24). We plot the weighted covariance as a function of genetic distance, and obtain a date by fitting an exponential function with an affine term:  , where d is the genetic distance in Morgans and n is the number of generations since mixture. We do not show inter-SNP intervals of <0.5 cM since we have found that at this distance admixture LD begins to be confounded by background LD.

