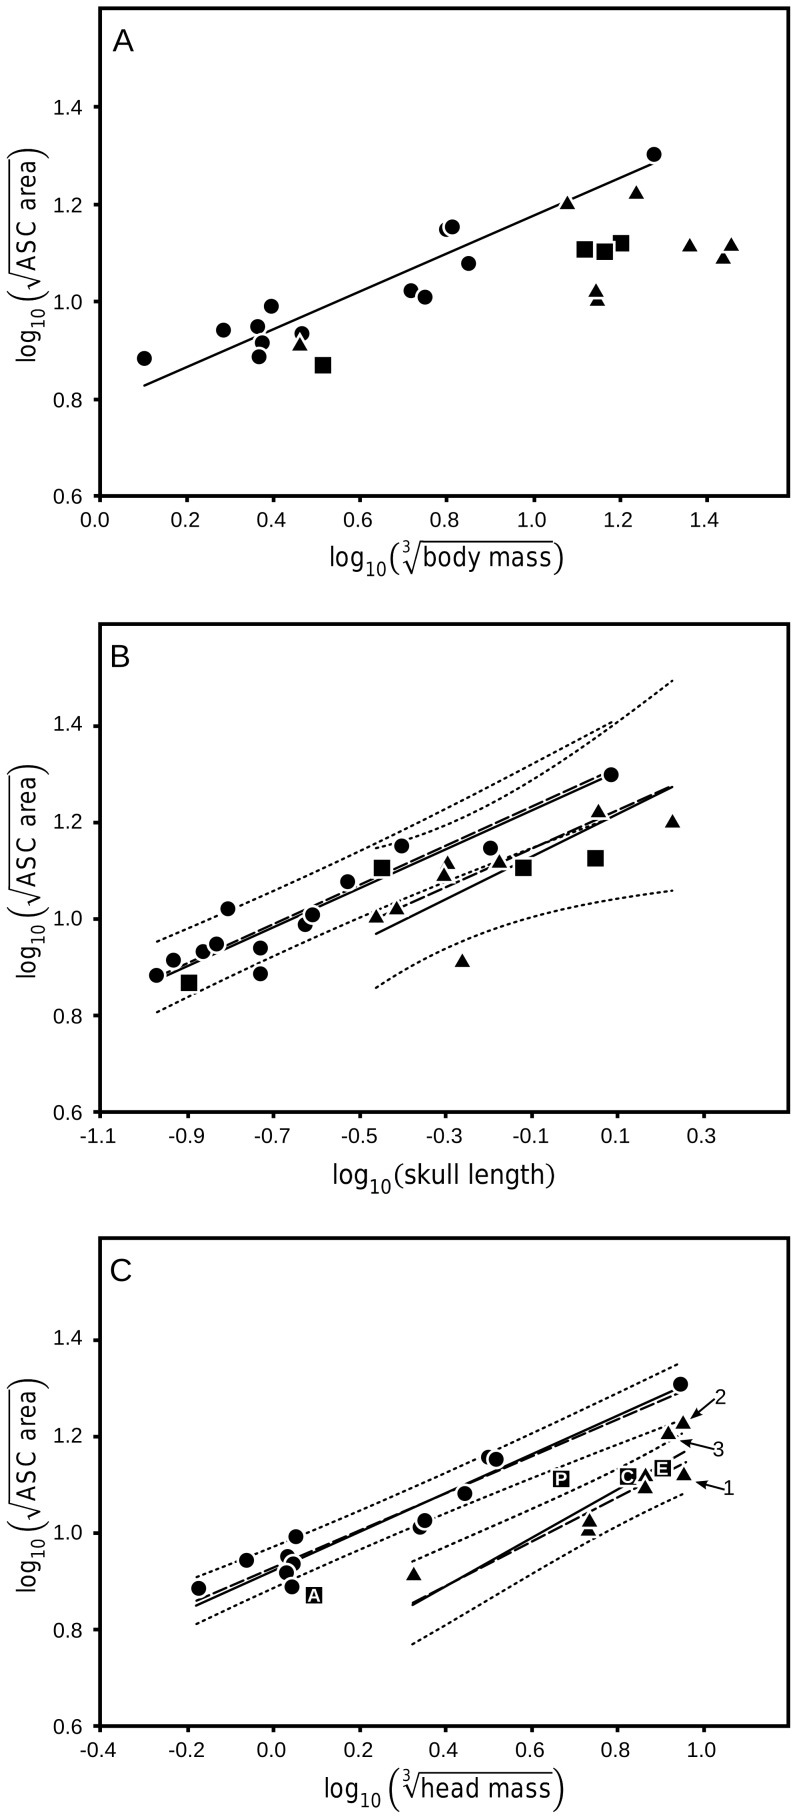
Figure 3. Anterior semicircular canal size in dinosaurs.
Anterior semicircular canal (ASC) area enclosed versus (A) body mass, (B) skull length, and (C) head mass. The bipedal correlations in (A), (B), & (C) are significant and the regressions are similar in slope. Quadrupedal taxa in (A) exhibit no significant correlation in contrast to (B) and (C) where the quadrupedal correlations are significant. In (B) and (C) the slope of the quadrupedal regression is statistically similar to the bipedal slope but significantly separated from it by a decrease in intercept. The intercept difference between the bipedal and quadrupedal groups in (C) is greater in magnitude than in (B) and when combined with the much stronger correlations in (C) this comparison produces the most robust discrimination between bipedal and quadrupedal taxa. The simplicity of the head mass estimation method employed in this study results in several notable estimation errors: the head size in Apatasaurus (1) is over-estimated and the head sizes of the derived ceratopsians, Triceratops (2) and Agujaceratops (3) are under-estimated. In each case, more accurate head mass estimations would shift these taxa closer to the quadrupedal regression line. Solid lines: standardized major axis regressions for significant correlations, dashed lines: phylogenetically correct ordinary least square regression (PCOLS), and dotted lines: 95% confidence interval for each group around the PCOLS. •: bipeds, ▴: quadrupeds, and ▪: taxa with ambiguous posture (A: Anchisaurus, C: Corythosaurus, E: Edmontosaurus, and P: Plateosurus).

