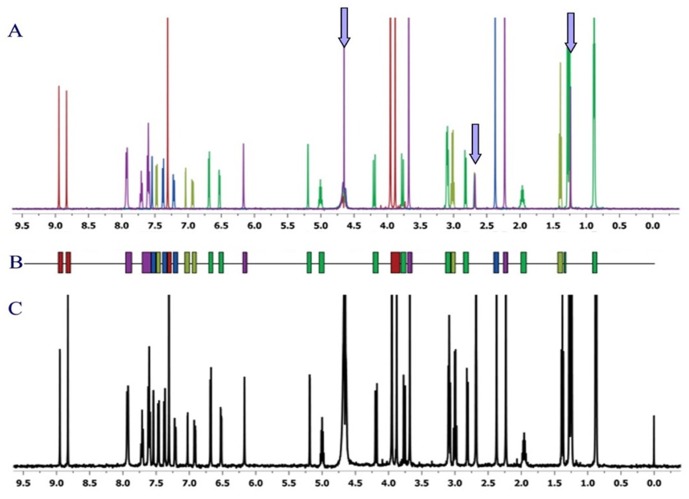
Figure 1. 1H- NMR spectra sample.
A: Overlaid 1H-NMR spectra of five different fragments (1 mM in sample buffer: 50 µM phosphate buffer pH 7.0, 50 µm NaCl, 3% DMSO-d6), recorded at 37°C and 500 MHz. The arrows indicate residual peaks from H2O, DMSO and t-butanol (internal standard). B: Fingerprint of an in silico-designed mixture with zero or near-zero signal overlap. C: 1H-NMR spectrum of the five fragments mixed together (500 uM each) under identical experimental conditions as in 1A (the signal at 0 ppm corresponds to DSS).

