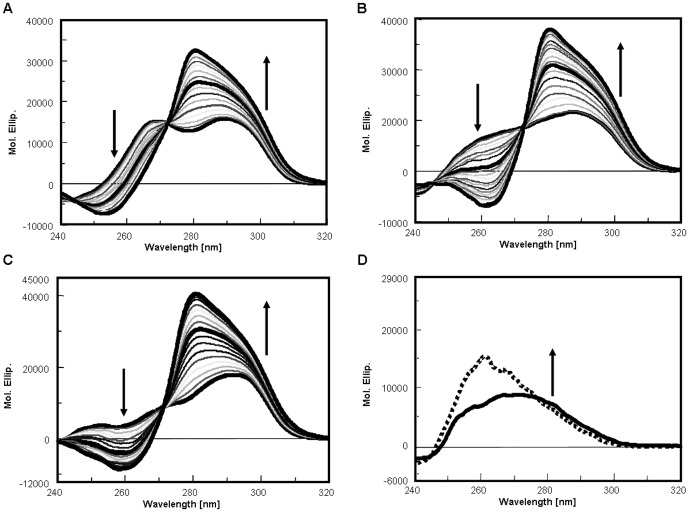
Figure 4. (K34)2Ni(II)-G-quadruplex bound form shows conserved CD spectra features.
Dichroic spectra of 4 µM Tel26 (Panel A), wtTel26 (Panel B), Tel22 (Panel C) or single strand scrambled scT22 (Panel D) in the presence of increasing concentrations of (K34)2Ni(II) at 25°C in 10 mM Tris, 20 mM KCl, at pH 7.5. Arrows indicate changes upon addition of the metal complex, curves in bold indicate spectra of the free oligonucleotide and at 1∶1 and 2∶1 ligand:DNA ratios in panels A–C. In panel D the solid line corresponds to the CD contribution of DNA alone, the dotted line represents the dichroic spectrum at saturating concentrations of (K34)2Ni(II).

