
Figure 2. The release of neurotrophic factor NPY following injury simulation is impaired in IP3R3−/− mice.
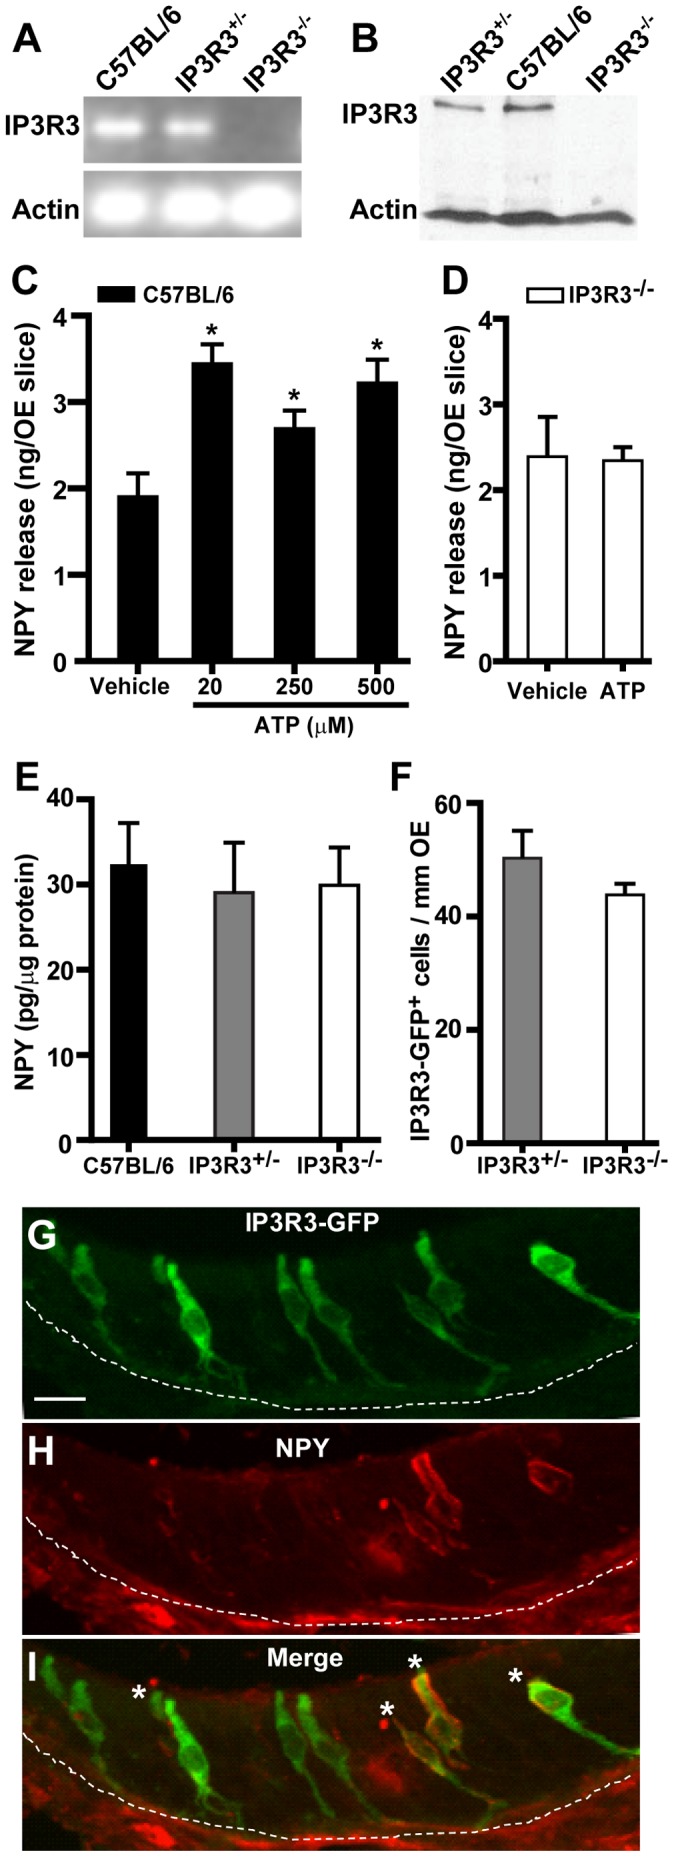
(A–B) The OE of IP3R3−/− mice does not express IP3R3. IP3R3 mRNA (A) and protein (B) in the OE of adult C57BL/6, IP3R3+/− and IP3R3−/− mice were measured by PCR and Western blot analysis. (C) ATP induces NPY release in the OE of C57BL/6 mice. Neonatal OE slices from C57BL/6 mice were incubated with vehicle (0.2% DMSO) or ATP (20, 250 or 500 µM) for 1 hour. * P<0.01 or 0.05 vs. vehicle (one-way ANOVA followed by Newman-Keuls post-hoc test; n = 4, 4, 4 and 5 replications, respectively.) (D) ATP does not induce NPY release in the OE of IP3R3−/− mice. Neonatal OE slices from IP3R3−/− mice were incubated with vehicle (0.2% DMSO) or ATP (50 µM) for 1 hour (p = 0.9, Student’s t-test; n = 5 replications, each.) (E) Protein levels of NPY in the OE of C57BL/6, IP3R3+/− and IP3R3−/− mice as quantified by ELISA (p = 0.6, one way ANOVA with Neuman-Keuls post-hoc test; n = 6, 4, 6 mice, respectively.) (F) The number of IP3R3-tauGFP+ cells in the OE of IP3R3+/− and IP3R3−/− mice are comparable (p = 0.09 Student’s t-test, n = 17 and 22 sections from 6 and 7 mice, respectively.) (G–I) GFP+ cells (F) and NPY+ cells (G) co-localize (H; *) in the OE of IP3R3-tau GFP mice. Scale bar = 10 µm.