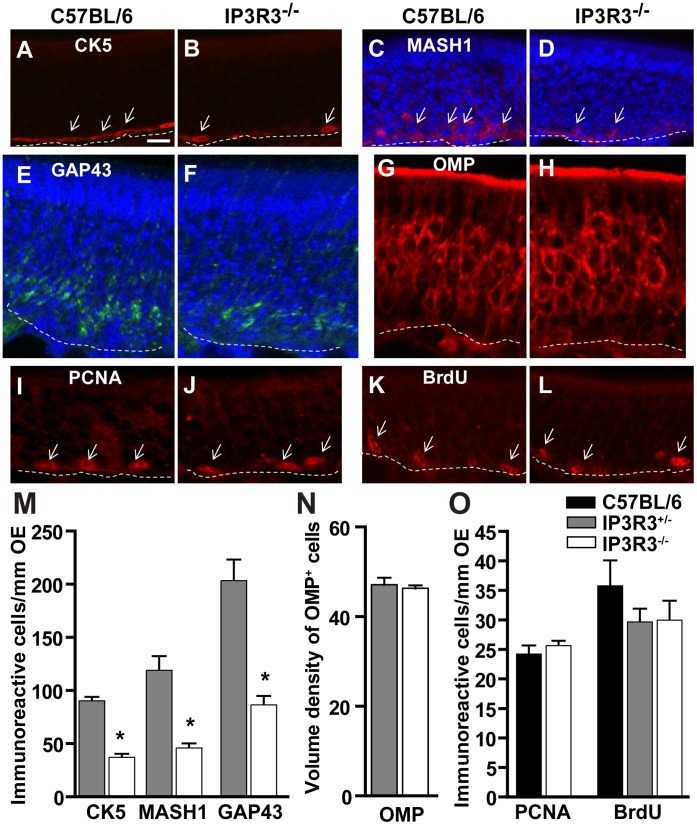
Figure 3. IP3R3−/− mice have fewer basal cells but a normal rate of proliferation in the OE.
(A–L) Representative immunoreactivity to cellular markers in adult C57BL/6 (A, C, E, G, I, K) and IP3R3−/− (B, D, F, H, J, L) mice: (A–B) horizontal basal cell marker cytokeratin 5 (CK5), (C–D) proneural transcription factor MASH1, (E–F) immature neuronal marker GAP43, (G–H) mature neuronal marker OMP, (I–L) proliferation cell marker PCNA and BrdU. DAPI (blue) demarcates the nuclei. Scale bar, 10 µm, shown in A is relevant for A–I. (M) The number of CK5+ HBCs, MASH1+ progenitor cells and GAP43+ immature neurons in the OE of IP3R3−/− mice are significantly reduced. *, p<0.01 vs. respective control in C57BL/6 (Student’s t-test for each cell marker; n = 9–12 sections from 3–4 mice. Refer to legend in (O) for (M–O). (N) The number of OMP+ neurons in the OE of IP3R3−/− is similar to C57BL/6 mice (p = 0.39, Student’s t-test; n = 9–12 sections from 3–4 mice.) (O) The rate of proliferation measured by PCNA expression and BrdU incorporation is comparable in the OE of IP3R3−/−, IP3R3+/− and C57BL/6 mice. p>0.05, Student’s t-test and one way ANOVA, respectively; n = 9–12 sections from 3–4 mice. Legend refers to M–O.

