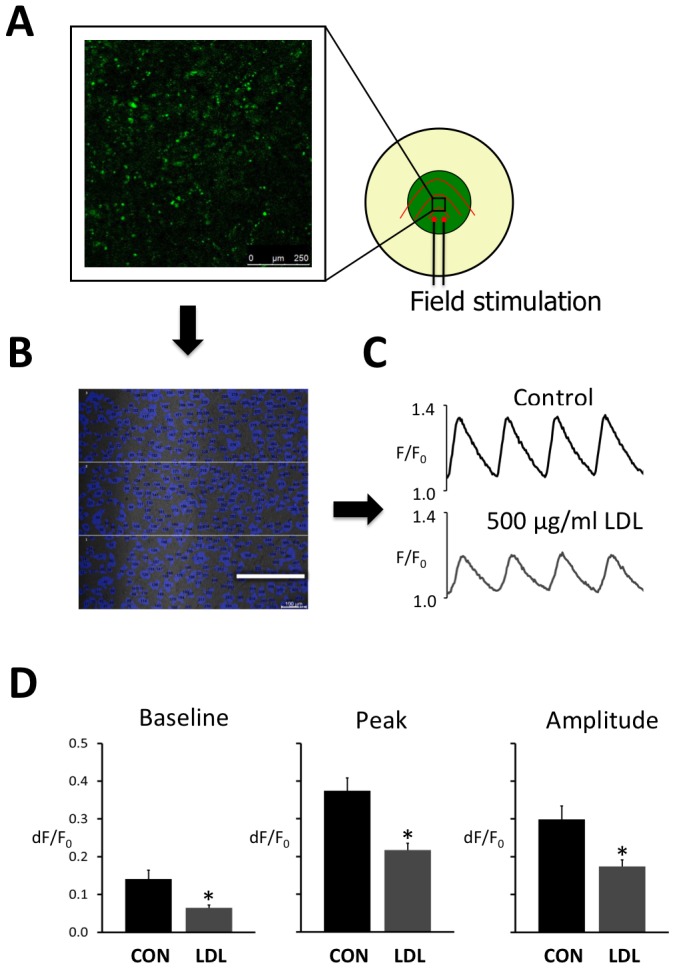
Figure 2. LDL reduces the intracellular Ca2+- transient.

A Schematic representation of a cell culture dish subjected to field stimulation with indication of the 1×1 mm field where calcium imaging is performed. B Image of the HL-1 cardiomyocyte culture with individual myocytes showing detectable calcium transients represented in blue. Scale bar is 250 µm. C Global calcium transients elicited by field stimulation at 2 s intervals in the absence of LDL (control) and the presence of 500 µg/ml LDL. D Average baseline (left panel), peak (center panel) and amplitude (right panel) of the calcium transients recorded without (CON) and with 500 µg/ml LDL. Values were recorded in three different fields from eight HL-1 preparations. Statistical differences between CON and LDL are indicated with an asterisk.
